29
/
en
AIzaSyAYiBZKx7MnpbEhh9jyipgxe19OcubqV5w
April 1, 2024
215045
Oman
OMN
true
2
1
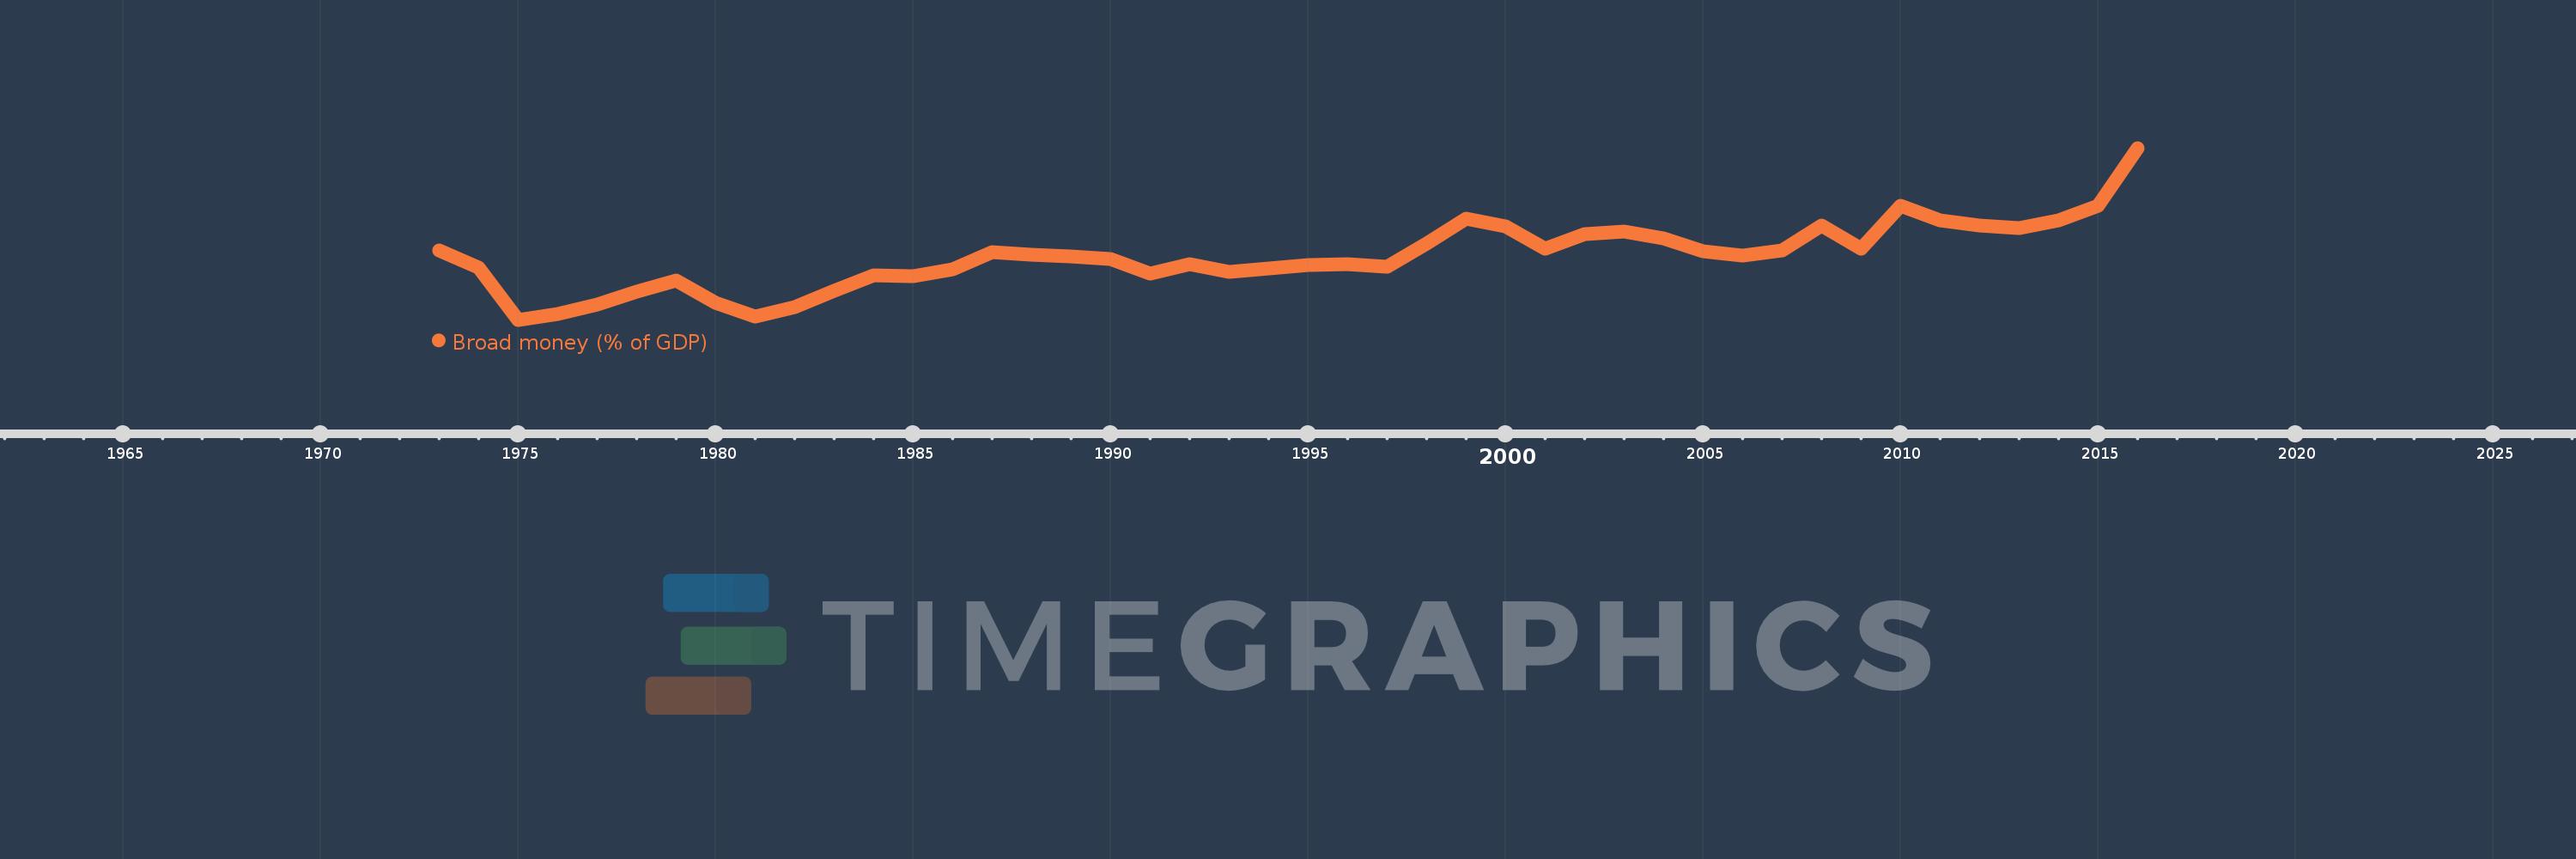
Broad money (% of GDP)
2016,2015,2014,2013,2012,2011,2010,2009,2008,2007,2006,2005,2004,2003,2002,2001,2000,1999,1998,1997,1996,1995,1994,1993,1992,1991,1990,1989,1988,1987,1986,1985,1984,1983,1982,1981,1980,1979,1978,1977,1976,1975,1974,1973
This statistics in other country:
AfghanistanAlbaniaAlgeriaAngolaAntigua and BarbudaArab WorldArgentinaArmeniaArubaAustraliaAzerbaijanBahamas, TheBahrainBangladeshBarbadosBelarusBelizeBeninBhutanBoliviaBosnia and HerzegovinaBotswanaBrazilBrunei DarussalamBulgariaBurkina FasoBurundiCabo VerdeCambodiaCameroonCanadaCaribbean small statesCentral African RepublicCentral Europe and the BalticsChadChileChinaColombiaComorosCongo, Dem. Rep.Congo, Rep.Costa RicaCote d'IvoireCroatiaCzech RepublicDenmarkDjiboutiDominicaDominican RepublicEarly-demographic dividendEast Asia & PacificEast Asia & Pacific (excluding high income)East Asia & Pacific (IDA & IBRD countries)EcuadorEgypt, Arab Rep.El SalvadorEquatorial GuineaEritreaEstoniaEthiopiaEurope & Central Asia (excluding high income)Europe & Central Asia (IDA & IBRD countries)FijiFragile and conflict affected situationsGabonGambia, TheGeorgiaGhanaGrenadaGuatemalaGuineaGuinea-BissauGuyanaHaitiHeavily indebted poor countries (HIPC)High incomeHondurasHong Kong SAR, ChinaHungaryIBRD onlyIcelandIDA & IBRD totalIDA blendIDA onlyIDA totalIndiaIndonesiaIran, Islamic Rep.IraqIsraelJamaicaJapanJordanKazakhstanKenyaKorea, Rep.KuwaitKyrgyz RepublicLao PDRLate-demographic dividendLatin America & Caribbean Latin America & Caribbean (excluding high income)Latin America & the Caribbean (IDA & IBRD countries)LatviaLeast developed countries: UN classificationLebanonLesothoLiberiaLibyaLithuaniaLow & middle incomeLow incomeLower middle incomeMacao SAR, ChinaMacedonia, FYRMadagascarMalawiMalaysiaMaldivesMaliMauritaniaMauritiusMexicoMicronesia, Fed. Sts.Middle East & North AfricaMiddle East & North Africa (excluding high income)Middle East & North Africa (IDA & IBRD countries)Middle incomeMoldovaMongoliaMoroccoMozambiqueMyanmarNamibiaNepalNew ZealandNicaraguaNigerNigeriaNorth AmericaNorwayOECD membersOmanOther small statesPacific island small statesPakistanPanamaPapua New GuineaParaguayPeruPhilippinesPolandPost-demographic dividendPre-demographic dividendQatarRomaniaRussian FederationRwandaSamoaSao Tome and PrincipeSaudi ArabiaSenegalSerbiaSeychellesSierra LeoneSingaporeSlovak RepublicSmall statesSolomon IslandsSouth AfricaSouth AsiaSouth Asia (IDA & IBRD)South SudanSri LankaSt. Kitts and NevisSt. LuciaSt. Vincent and the GrenadinesSub-Saharan Africa Sub-Saharan Africa (excluding high income)Sub-Saharan Africa (IDA & IBRD countries)SudanSurinameSwazilandSwedenSwitzerlandSyrian Arab RepublicTajikistanTanzaniaThailandTimor-LesteTogoTongaTrinidad and TobagoTunisiaTurkeyUgandaUkraineUnited Arab EmiratesUnited KingdomUnited StatesUpper middle incomeUruguayVanuatuVenezuela, RBVietnamWest Bank and GazaWorldYemen, Rep.ZambiaZimbabwe Timeline:
This timeline shows a graph from 1973 to 2016 of Oman. No data until 1972. Number of actual observations by date: 44.
Source name:
World Development Indicators
Source organization:
International Monetary Fund, International Financial Statistics and data files, and World Bank and OECD GDP estimates.
Categories, topics:
Financial Sector
Last updated:
apr 23, 2017
Indicators value changes by year
Minimum:
14.994
jan 1, 1975
Maximum:
56.412
jan 1, 2016
At the date of observation
Value
Absolute change
Change from previous value
jan 1, 1973
31.789
+31.789
0.0%
jan 1, 1974
27.512
-4.277
-13.46%
jan 1, 1975
14.994
-12.518
-45.5%
jan 1, 1976
16.292
+1.298
8.66%
jan 1, 1977
18.613
+2.321
14.25%
jan 1, 1978
21.816
+3.204
17.21%
jan 1, 1979
24.365
+2.549
11.68%
jan 1, 1980
19.094
-5.271
-21.63%
jan 1, 1981
15.73
-3.364
-17.62%
jan 1, 1982
17.975
+2.245
14.27%
jan 1, 1983
21.877
+3.902
21.71%
jan 1, 1984
25.715
+3.837
17.54%
jan 1, 1985
25.403
-0.312
-1.21%
jan 1, 1986
27.112
+1.709
6.73%
jan 1, 1987
31.22
+4.108
15.15%
jan 1, 1988
30.615
-0.605
-1.94%
jan 1, 1989
30.209
-0.406
-1.33%
jan 1, 1990
29.575
-0.634
-2.1%
jan 1, 1991
26.086
-3.489
-11.8%
jan 1, 1992
28.342
+2.255
8.65%
jan 1, 1993
26.611
-1.731
-6.11%
jan 1, 1994
27.385
+0.774
2.91%
jan 1, 1995
28.266
+0.881
3.22%
jan 1, 1996
28.487
+0.221
0.78%
jan 1, 1997
27.814
-0.673
-2.36%
jan 1, 1998
33.405
+5.59
20.1%
jan 1, 1999
39.351
+5.947
17.8%
jan 1, 2000
37.537
-1.814
-4.61%
jan 1, 2001
32.051
-5.486
-14.61%
jan 1, 2002
35.615
+3.564
11.12%
jan 1, 2003
36.305
+0.689
1.94%
jan 1, 2004
34.621
-1.683
-4.64%
jan 1, 2005
31.48
-3.141
-9.07%
jan 1, 2006
30.512
-0.968
-3.08%
jan 1, 2007
31.713
+1.202
3.94%
jan 1, 2008
37.767
+6.054
19.09%
jan 1, 2009
32.168
-5.598
-14.82%
jan 1, 2010
42.407
+10.238
31.83%
jan 1, 2011
38.961
-3.446
-8.13%
jan 1, 2012
37.726
-1.235
-3.17%
jan 1, 2013
37.006
-0.72
-1.91%
jan 1, 2014
39.002
+1.996
5.39%
jan 1, 2015
42.564
+3.561
9.13%
jan 1, 2016
56.412
+13.848
32.53%
Ranking of countries by current statistics by years


Comments: