29
/
en
AIzaSyAYiBZKx7MnpbEhh9jyipgxe19OcubqV5w
April 1, 2024
193941
Mauritius
MUS
true
2
1
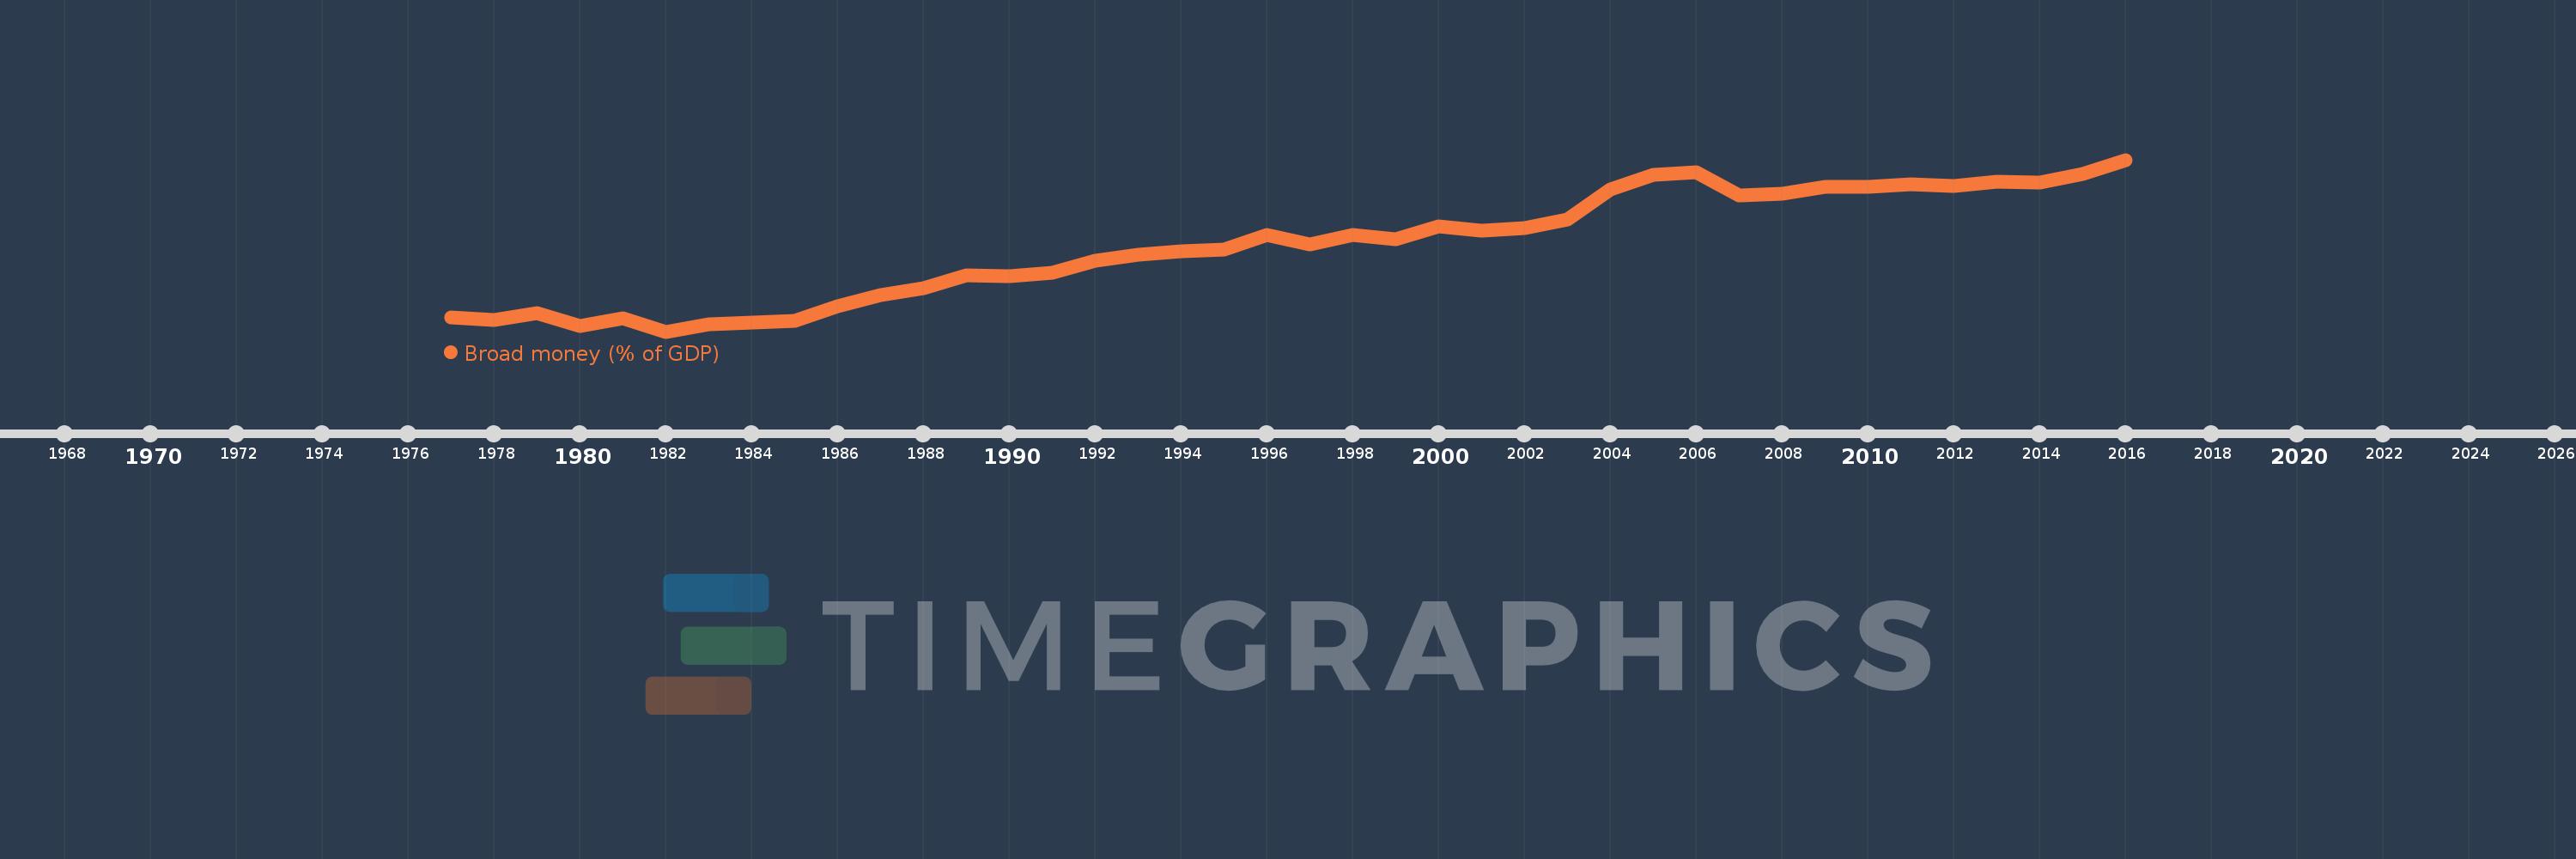
Broad money (% of GDP)
2016,2015,2014,2013,2012,2011,2010,2009,2008,2007,2006,2005,2004,2003,2002,2001,2000,1999,1998,1997,1996,1995,1994,1993,1992,1991,1990,1989,1988,1987,1986,1985,1984,1983,1982,1981,1980,1979,1978,1977
This statistics in other country:
AfghanistanAlbaniaAlgeriaAngolaAntigua and BarbudaArab WorldArgentinaArmeniaArubaAustraliaAzerbaijanBahamas, TheBahrainBangladeshBarbadosBelarusBelizeBeninBhutanBoliviaBosnia and HerzegovinaBotswanaBrazilBrunei DarussalamBulgariaBurkina FasoBurundiCabo VerdeCambodiaCameroonCanadaCaribbean small statesCentral African RepublicCentral Europe and the BalticsChadChileChinaColombiaComorosCongo, Dem. Rep.Congo, Rep.Costa RicaCote d'IvoireCroatiaCzech RepublicDenmarkDjiboutiDominicaDominican RepublicEarly-demographic dividendEast Asia & PacificEast Asia & Pacific (excluding high income)East Asia & Pacific (IDA & IBRD countries)EcuadorEgypt, Arab Rep.El SalvadorEquatorial GuineaEritreaEstoniaEthiopiaEurope & Central Asia (excluding high income)Europe & Central Asia (IDA & IBRD countries)FijiFragile and conflict affected situationsGabonGambia, TheGeorgiaGhanaGrenadaGuatemalaGuineaGuinea-BissauGuyanaHaitiHeavily indebted poor countries (HIPC)High incomeHondurasHong Kong SAR, ChinaHungaryIBRD onlyIcelandIDA & IBRD totalIDA blendIDA onlyIDA totalIndiaIndonesiaIran, Islamic Rep.IraqIsraelJamaicaJapanJordanKazakhstanKenyaKorea, Rep.KuwaitKyrgyz RepublicLao PDRLate-demographic dividendLatin America & Caribbean Latin America & Caribbean (excluding high income)Latin America & the Caribbean (IDA & IBRD countries)LatviaLeast developed countries: UN classificationLebanonLesothoLiberiaLibyaLithuaniaLow & middle incomeLow incomeLower middle incomeMacao SAR, ChinaMacedonia, FYRMadagascarMalawiMalaysiaMaldivesMaliMauritaniaMauritiusMexicoMicronesia, Fed. Sts.Middle East & North AfricaMiddle East & North Africa (excluding high income)Middle East & North Africa (IDA & IBRD countries)Middle incomeMoldovaMongoliaMoroccoMozambiqueMyanmarNamibiaNepalNew ZealandNicaraguaNigerNigeriaNorth AmericaNorwayOECD membersOmanOther small statesPacific island small statesPakistanPanamaPapua New GuineaParaguayPeruPhilippinesPolandPost-demographic dividendPre-demographic dividendQatarRomaniaRussian FederationRwandaSamoaSao Tome and PrincipeSaudi ArabiaSenegalSerbiaSeychellesSierra LeoneSingaporeSlovak RepublicSmall statesSolomon IslandsSouth AfricaSouth AsiaSouth Asia (IDA & IBRD)South SudanSri LankaSt. Kitts and NevisSt. LuciaSt. Vincent and the GrenadinesSub-Saharan Africa Sub-Saharan Africa (excluding high income)Sub-Saharan Africa (IDA & IBRD countries)SudanSurinameSwazilandSwedenSwitzerlandSyrian Arab RepublicTajikistanTanzaniaThailandTimor-LesteTogoTongaTrinidad and TobagoTunisiaTurkeyUgandaUkraineUnited Arab EmiratesUnited KingdomUnited StatesUpper middle incomeUruguayVanuatuVenezuela, RBVietnamWest Bank and GazaWorldYemen, Rep.ZambiaZimbabwe Timeline:
This timeline shows a graph from 1977 to 2016 of Mauritius. No data until 1976. Number of actual observations by date: 40.
Source name:
World Development Indicators
Source organization:
International Monetary Fund, International Financial Statistics and data files, and World Bank and OECD GDP estimates.
Categories, topics:
Financial Sector
Last updated:
apr 23, 2017
Indicators value changes by year
Minimum:
39.926
jan 1, 1982
Maximum:
106.953
jan 1, 2016
At the date of observation
Value
Absolute change
Change from previous value
jan 1, 1977
45.345
+45.345
0.0%
jan 1, 1978
44.607
-0.738
-1.63%
jan 1, 1979
47.199
+2.592
5.81%
jan 1, 1980
41.948
-5.251
-11.12%
jan 1, 1981
45.099
+3.15
7.51%
jan 1, 1982
39.926
-5.172
-11.47%
jan 1, 1983
42.872
+2.946
7.38%
jan 1, 1984
43.349
+0.477
1.11%
jan 1, 1985
43.978
+0.629
1.45%
jan 1, 1986
49.829
+5.85
13.3%
jan 1, 1987
54.116
+4.287
8.6%
jan 1, 1988
56.945
+2.829
5.23%
jan 1, 1989
61.788
+4.843
8.5%
jan 1, 1990
61.477
-0.31
-0.5%
jan 1, 1991
63.041
+1.564
2.54%
jan 1, 1992
67.684
+4.643
7.37%
jan 1, 1993
69.842
+2.158
3.19%
jan 1, 1994
71.181
+1.339
1.92%
jan 1, 1995
72.005
+0.823
1.16%
jan 1, 1996
77.677
+5.672
7.88%
jan 1, 1997
73.939
-3.738
-4.81%
jan 1, 1998
77.466
+3.527
4.77%
jan 1, 1999
75.932
-1.534
-1.98%
jan 1, 2000
80.924
+4.992
6.57%
jan 1, 2001
79.424
-1.501
-1.85%
jan 1, 2002
80.353
+0.929
1.17%
jan 1, 2003
83.734
+3.381
4.21%
jan 1, 2004
95.555
+11.821
14.12%
jan 1, 2005
101.233
+5.678
5.94%
jan 1, 2006
102.207
+0.975
0.96%
jan 1, 2007
93.113
-9.094
-8.9%
jan 1, 2008
93.773
+0.66
0.71%
jan 1, 2009
96.503
+2.73
2.91%
jan 1, 2010
96.254
-0.249
-0.26%
jan 1, 2011
97.491
+1.237
1.29%
jan 1, 2012
96.64
-0.852
-0.87%
jan 1, 2013
98.566
+1.927
1.99%
jan 1, 2014
98.177
-0.389
-0.39%
jan 1, 2015
101.401
+3.224
3.28%
jan 1, 2016
106.953
+5.552
5.47%
Ranking of countries by current statistics by years


Comments: