29
/
en
AIzaSyAYiBZKx7MnpbEhh9jyipgxe19OcubqV5w
April 1, 2024
240241
Singapore
SGP
true
2
1
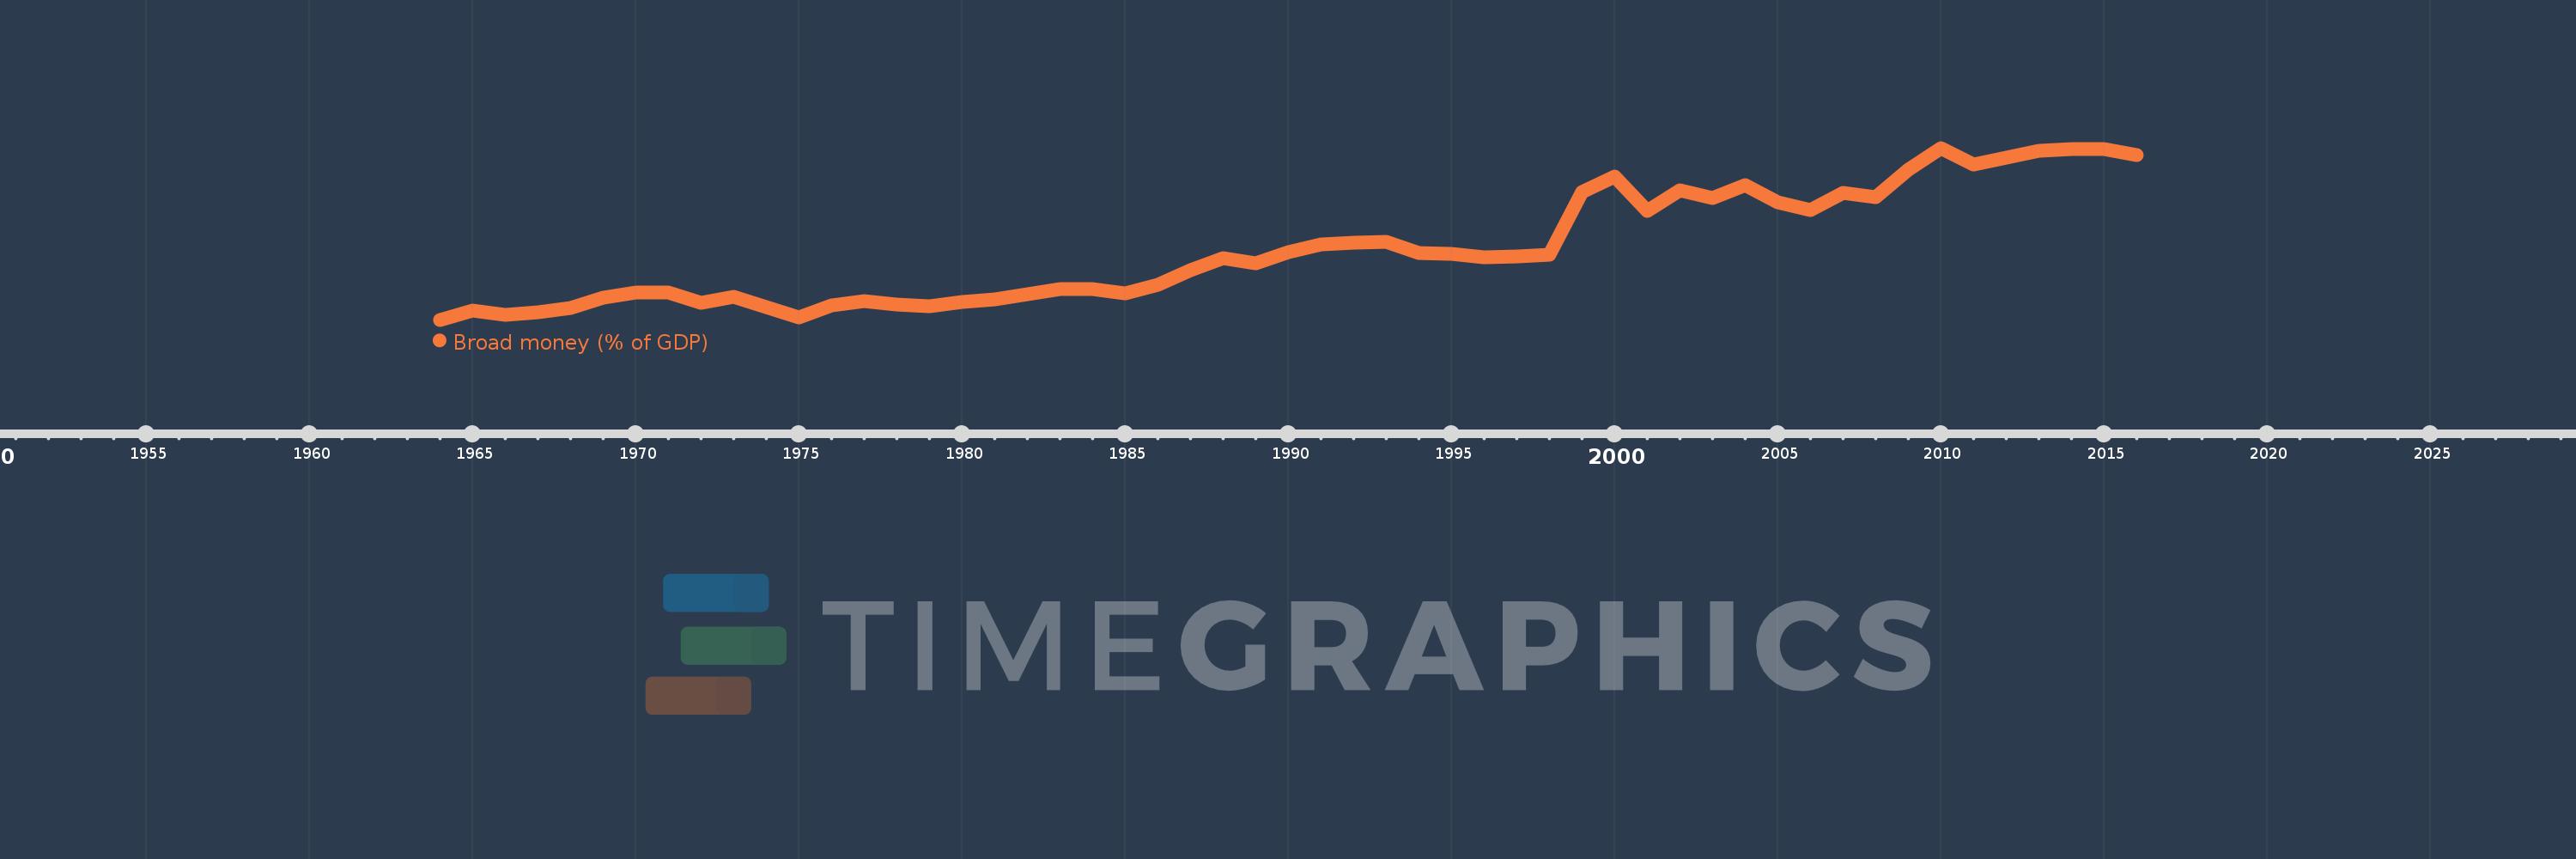
Broad money (% of GDP)
2016,2015,2014,2013,2012,2011,2010,2009,2008,2007,2006,2005,2004,2003,2002,2001,2000,1999,1998,1997,1996,1995,1994,1993,1992,1991,1990,1989,1988,1987,1986,1985,1984,1983,1982,1981,1980,1979,1978,1977,1976,1975,1974,1973,1972,1971,1970,1969,1968,1967,1966,1965,1964
This statistics in other country:
AfghanistanAlbaniaAlgeriaAngolaAntigua and BarbudaArab WorldArgentinaArmeniaArubaAustraliaAzerbaijanBahamas, TheBahrainBangladeshBarbadosBelarusBelizeBeninBhutanBoliviaBosnia and HerzegovinaBotswanaBrazilBrunei DarussalamBulgariaBurkina FasoBurundiCabo VerdeCambodiaCameroonCanadaCaribbean small statesCentral African RepublicCentral Europe and the BalticsChadChileChinaColombiaComorosCongo, Dem. Rep.Congo, Rep.Costa RicaCote d'IvoireCroatiaCzech RepublicDenmarkDjiboutiDominicaDominican RepublicEarly-demographic dividendEast Asia & PacificEast Asia & Pacific (excluding high income)East Asia & Pacific (IDA & IBRD countries)EcuadorEgypt, Arab Rep.El SalvadorEquatorial GuineaEritreaEstoniaEthiopiaEurope & Central Asia (excluding high income)Europe & Central Asia (IDA & IBRD countries)FijiFragile and conflict affected situationsGabonGambia, TheGeorgiaGhanaGrenadaGuatemalaGuineaGuinea-BissauGuyanaHaitiHeavily indebted poor countries (HIPC)High incomeHondurasHong Kong SAR, ChinaHungaryIBRD onlyIcelandIDA & IBRD totalIDA blendIDA onlyIDA totalIndiaIndonesiaIran, Islamic Rep.IraqIsraelJamaicaJapanJordanKazakhstanKenyaKorea, Rep.KuwaitKyrgyz RepublicLao PDRLate-demographic dividendLatin America & Caribbean Latin America & Caribbean (excluding high income)Latin America & the Caribbean (IDA & IBRD countries)LatviaLeast developed countries: UN classificationLebanonLesothoLiberiaLibyaLithuaniaLow & middle incomeLow incomeLower middle incomeMacao SAR, ChinaMacedonia, FYRMadagascarMalawiMalaysiaMaldivesMaliMauritaniaMauritiusMexicoMicronesia, Fed. Sts.Middle East & North AfricaMiddle East & North Africa (excluding high income)Middle East & North Africa (IDA & IBRD countries)Middle incomeMoldovaMongoliaMoroccoMozambiqueMyanmarNamibiaNepalNew ZealandNicaraguaNigerNigeriaNorth AmericaNorwayOECD membersOmanOther small statesPacific island small statesPakistanPanamaPapua New GuineaParaguayPeruPhilippinesPolandPost-demographic dividendPre-demographic dividendQatarRomaniaRussian FederationRwandaSamoaSao Tome and PrincipeSaudi ArabiaSenegalSerbiaSeychellesSierra LeoneSingaporeSlovak RepublicSmall statesSolomon IslandsSouth AfricaSouth AsiaSouth Asia (IDA & IBRD)South SudanSri LankaSt. Kitts and NevisSt. LuciaSt. Vincent and the GrenadinesSub-Saharan Africa Sub-Saharan Africa (excluding high income)Sub-Saharan Africa (IDA & IBRD countries)SudanSurinameSwazilandSwedenSwitzerlandSyrian Arab RepublicTajikistanTanzaniaThailandTimor-LesteTogoTongaTrinidad and TobagoTunisiaTurkeyUgandaUkraineUnited Arab EmiratesUnited KingdomUnited StatesUpper middle incomeUruguayVanuatuVenezuela, RBVietnamWest Bank and GazaWorldYemen, Rep.ZambiaZimbabwe Timeline:
This timeline shows a graph from 1964 to 2016 of Singapore. No data until 1963. Number of actual observations by date: 53.
Source name:
World Development Indicators
Source organization:
International Monetary Fund, International Financial Statistics and data files, and World Bank and OECD GDP estimates.
Categories, topics:
Financial Sector
Last updated:
apr 23, 2017
Indicators value changes by year
Minimum:
52.853
jan 1, 1964
Maximum:
132.642
jan 1, 2010
At the date of observation
Value
Absolute change
Change from previous value
jan 1, 1964
52.853
+52.853
0.0%
jan 1, 1965
56.947
+4.094
7.75%
jan 1, 1966
55.295
-1.652
-2.9%
jan 1, 1967
56.397
+1.102
1.99%
jan 1, 1968
58.395
+1.998
3.54%
jan 1, 1969
63.224
+4.829
8.27%
jan 1, 1970
65.607
+2.384
3.77%
jan 1, 1971
65.487
-0.121
-0.18%
jan 1, 1972
60.712
-4.774
-7.29%
jan 1, 1973
63.657
+2.945
4.85%
jan 1, 1974
58.737
-4.92
-7.73%
jan 1, 1975
54.011
-4.726
-8.05%
jan 1, 1976
59.47
+5.459
10.11%
jan 1, 1977
61.339
+1.869
3.14%
jan 1, 1978
59.973
-1.366
-2.23%
jan 1, 1979
59.245
-0.729
-1.21%
jan 1, 1980
61.029
+1.784
3.01%
jan 1, 1981
62.115
+1.086
1.78%
jan 1, 1982
64.825
+2.71
4.36%
jan 1, 1983
67.13
+2.305
3.56%
jan 1, 1984
67.102
-0.028
-0.04%
jan 1, 1985
65.033
-2.069
-3.08%
jan 1, 1986
68.95
+3.917
6.02%
jan 1, 1987
75.772
+6.822
9.89%
jan 1, 1988
81.512
+5.74
7.58%
jan 1, 1989
78.875
-2.637
-3.23%
jan 1, 1990
84.192
+5.317
6.74%
jan 1, 1991
87.714
+3.522
4.18%
jan 1, 1992
88.524
+0.81
0.92%
jan 1, 1993
89.131
+0.607
0.69%
jan 1, 1994
83.815
-5.316
-5.96%
jan 1, 1995
83.398
-0.417
-0.5%
jan 1, 1996
81.853
-1.546
-1.85%
jan 1, 1997
82.36
+0.507
0.62%
jan 1, 1998
83.002
+0.643
0.78%
jan 1, 1999
112.091
+29.089
35.05%
jan 1, 2000
119.299
+7.207
6.43%
jan 1, 2001
103.438
-15.86
-13.29%
jan 1, 2002
113.086
+9.648
9.33%
jan 1, 2003
109.523
-3.563
-3.15%
jan 1, 2004
115.286
+5.763
5.26%
jan 1, 2005
107.242
-8.044
-6.98%
jan 1, 2006
103.642
-3.6
-3.36%
jan 1, 2007
111.725
+8.083
7.8%
jan 1, 2008
109.699
-2.026
-1.81%
jan 1, 2009
122.586
+12.887
11.75%
jan 1, 2010
132.642
+10.056
8.2%
jan 1, 2011
125.045
-7.597
-5.73%
jan 1, 2012
128.074
+3.029
2.42%
jan 1, 2013
131.506
+3.432
2.68%
jan 1, 2014
131.978
+0.472
0.36%
jan 1, 2015
132.012
+0.034
0.03%
jan 1, 2016
129.266
-2.747
-2.08%
Ranking of countries by current statistics by years


Comments: