29
/
en
AIzaSyAYiBZKx7MnpbEhh9jyipgxe19OcubqV5w
April 1, 2024
266588
Trinidad and Tobago
TTO
true
2
1
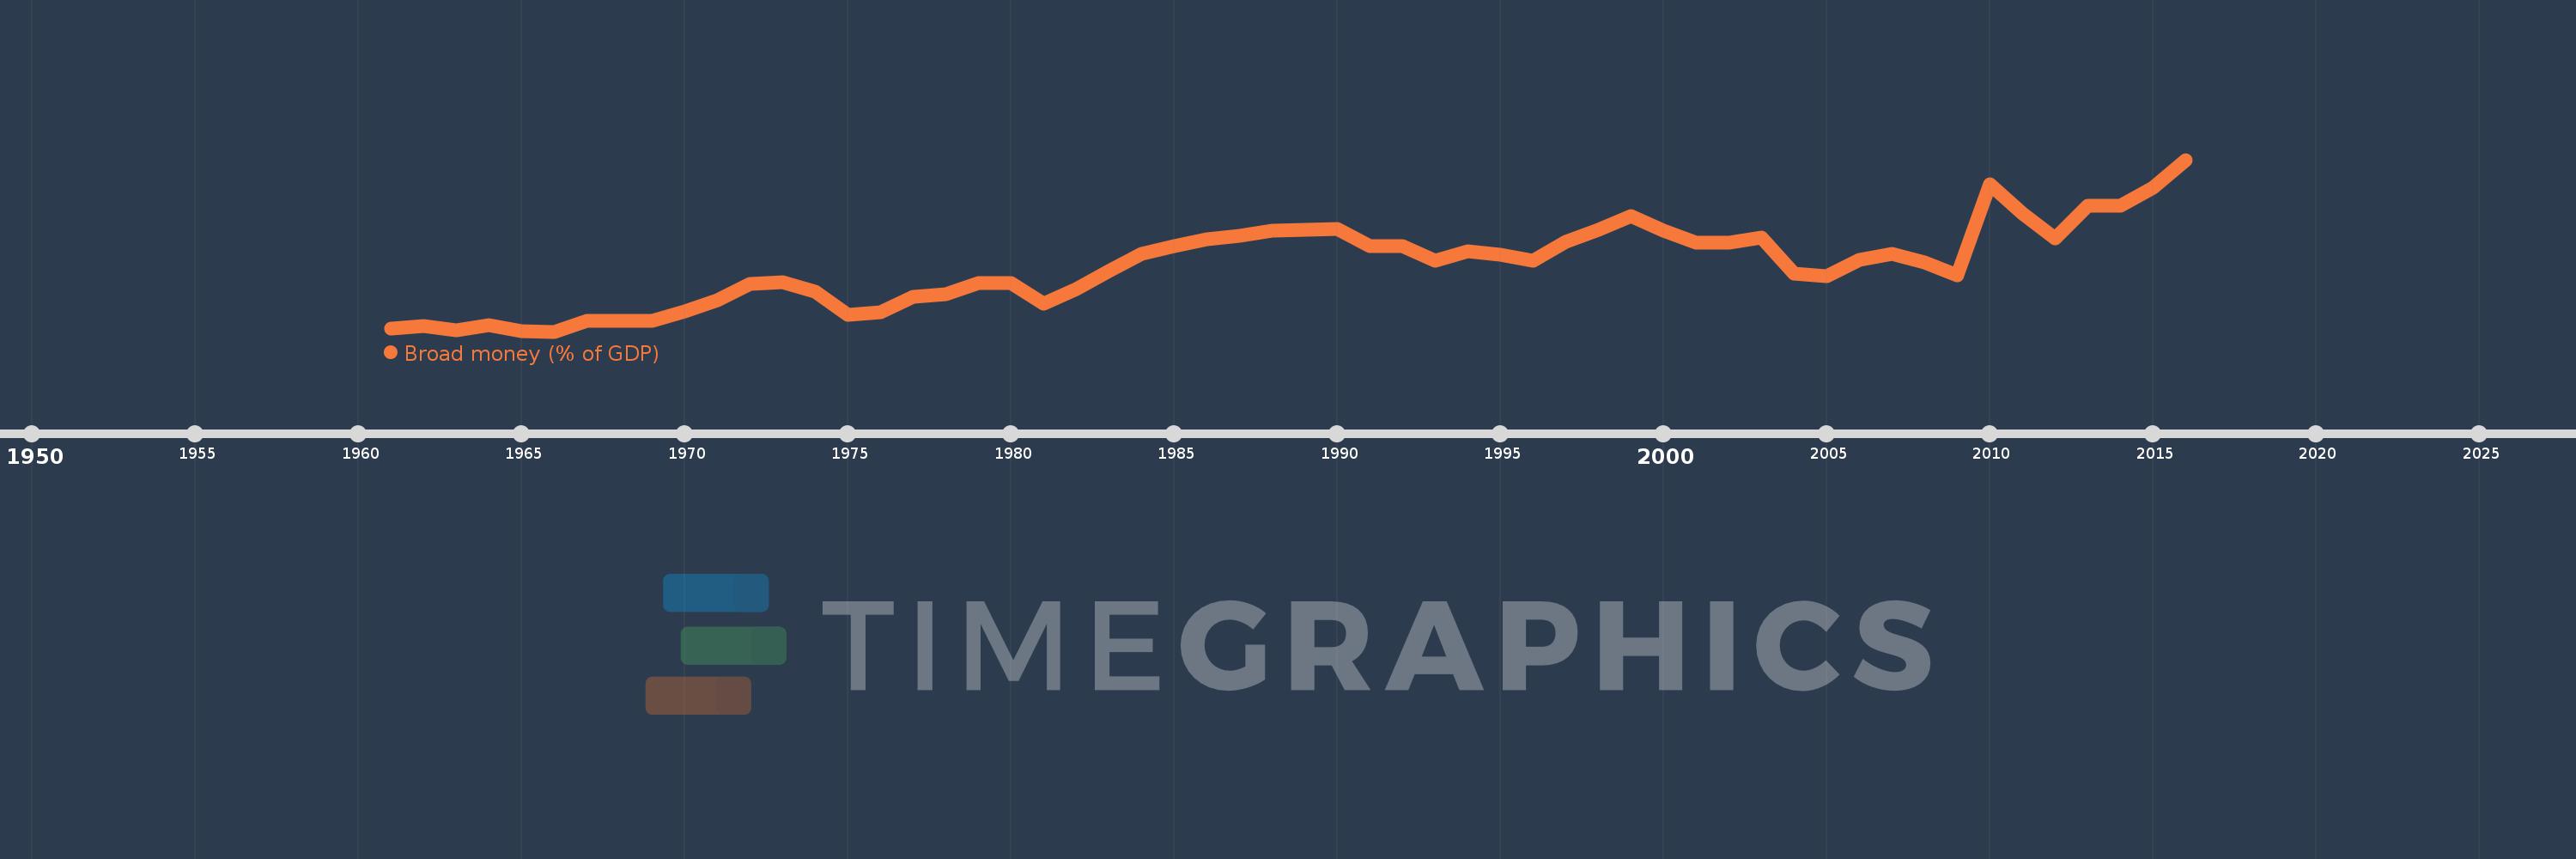
Broad money (% of GDP)
2016,2015,2014,2013,2012,2011,2010,2009,2008,2007,2006,2005,2004,2003,2002,2001,2000,1999,1998,1997,1996,1995,1994,1993,1992,1991,1990,1989,1988,1987,1986,1985,1984,1983,1982,1981,1980,1979,1978,1977,1976,1975,1974,1973,1972,1971,1970,1969,1968,1967,1966,1965,1964,1963,1962,1961
This statistics in other country:
AfghanistanAlbaniaAlgeriaAngolaAntigua and BarbudaArab WorldArgentinaArmeniaArubaAustraliaAzerbaijanBahamas, TheBahrainBangladeshBarbadosBelarusBelizeBeninBhutanBoliviaBosnia and HerzegovinaBotswanaBrazilBrunei DarussalamBulgariaBurkina FasoBurundiCabo VerdeCambodiaCameroonCanadaCaribbean small statesCentral African RepublicCentral Europe and the BalticsChadChileChinaColombiaComorosCongo, Dem. Rep.Congo, Rep.Costa RicaCote d'IvoireCroatiaCzech RepublicDenmarkDjiboutiDominicaDominican RepublicEarly-demographic dividendEast Asia & PacificEast Asia & Pacific (excluding high income)East Asia & Pacific (IDA & IBRD countries)EcuadorEgypt, Arab Rep.El SalvadorEquatorial GuineaEritreaEstoniaEthiopiaEurope & Central Asia (excluding high income)Europe & Central Asia (IDA & IBRD countries)FijiFragile and conflict affected situationsGabonGambia, TheGeorgiaGhanaGrenadaGuatemalaGuineaGuinea-BissauGuyanaHaitiHeavily indebted poor countries (HIPC)High incomeHondurasHong Kong SAR, ChinaHungaryIBRD onlyIcelandIDA & IBRD totalIDA blendIDA onlyIDA totalIndiaIndonesiaIran, Islamic Rep.IraqIsraelJamaicaJapanJordanKazakhstanKenyaKorea, Rep.KuwaitKyrgyz RepublicLao PDRLate-demographic dividendLatin America & Caribbean Latin America & Caribbean (excluding high income)Latin America & the Caribbean (IDA & IBRD countries)LatviaLeast developed countries: UN classificationLebanonLesothoLiberiaLibyaLithuaniaLow & middle incomeLow incomeLower middle incomeMacao SAR, ChinaMacedonia, FYRMadagascarMalawiMalaysiaMaldivesMaliMauritaniaMauritiusMexicoMicronesia, Fed. Sts.Middle East & North AfricaMiddle East & North Africa (excluding high income)Middle East & North Africa (IDA & IBRD countries)Middle incomeMoldovaMongoliaMoroccoMozambiqueMyanmarNamibiaNepalNew ZealandNicaraguaNigerNigeriaNorth AmericaNorwayOECD membersOmanOther small statesPacific island small statesPakistanPanamaPapua New GuineaParaguayPeruPhilippinesPolandPost-demographic dividendPre-demographic dividendQatarRomaniaRussian FederationRwandaSamoaSao Tome and PrincipeSaudi ArabiaSenegalSerbiaSeychellesSierra LeoneSingaporeSlovak RepublicSmall statesSolomon IslandsSouth AfricaSouth AsiaSouth Asia (IDA & IBRD)South SudanSri LankaSt. Kitts and NevisSt. LuciaSt. Vincent and the GrenadinesSub-Saharan Africa Sub-Saharan Africa (excluding high income)Sub-Saharan Africa (IDA & IBRD countries)SudanSurinameSwazilandSwedenSwitzerlandSyrian Arab RepublicTajikistanTanzaniaThailandTimor-LesteTogoTongaTrinidad and TobagoTunisiaTurkeyUgandaUkraineUnited Arab EmiratesUnited KingdomUnited StatesUpper middle incomeUruguayVanuatuVenezuela, RBVietnamWest Bank and GazaWorldYemen, Rep.ZambiaZimbabwe Timeline:
This timeline shows a graph from 1961 to 2016 of Trinidad and Tobago. No data until 1960. Number of actual observations by date: 56.
Source name:
World Development Indicators
Source organization:
International Monetary Fund, International Financial Statistics and data files, and World Bank and OECD GDP estimates.
Categories, topics:
Financial Sector
Last updated:
apr 23, 2017
Indicators value changes by year
Minimum:
20.876
jan 1, 1966
Maximum:
68.947
jan 1, 2016
At the date of observation
Value
Absolute change
Change from previous value
jan 1, 1961
21.66
+21.66
0.0%
jan 1, 1962
22.467
+0.808
3.73%
jan 1, 1963
21.211
-1.256
-5.59%
jan 1, 1964
22.594
+1.383
6.52%
jan 1, 1965
20.903
-1.691
-7.48%
jan 1, 1966
20.876
-0.027
-0.13%
jan 1, 1967
23.761
+2.885
13.82%
jan 1, 1968
23.807
+0.046
0.19%
jan 1, 1969
23.844
+0.037
0.15%
jan 1, 1970
26.636
+2.793
11.71%
jan 1, 1971
29.726
+3.089
11.6%
jan 1, 1972
34.212
+4.487
15.09%
jan 1, 1973
34.73
+0.517
1.51%
jan 1, 1974
32.088
-2.642
-7.61%
jan 1, 1975
25.583
-6.505
-20.27%
jan 1, 1976
26.194
+0.611
2.39%
jan 1, 1977
30.594
+4.4
16.8%
jan 1, 1978
31.327
+0.733
2.4%
jan 1, 1979
34.402
+3.075
9.81%
jan 1, 1980
34.544
+0.143
0.41%
jan 1, 1981
28.718
-5.827
-16.87%
jan 1, 1982
32.728
+4.01
13.96%
jan 1, 1983
37.851
+5.123
15.65%
jan 1, 1984
42.579
+4.729
12.49%
jan 1, 1985
44.809
+2.23
5.24%
jan 1, 1986
46.726
+1.917
4.28%
jan 1, 1987
47.583
+0.858
1.84%
jan 1, 1988
49.198
+1.615
3.39%
jan 1, 1989
49.46
+0.262
0.53%
jan 1, 1990
49.495
+0.035
0.07%
jan 1, 1991
44.856
-4.639
-9.37%
jan 1, 1992
44.796
-0.061
-0.13%
jan 1, 1993
40.8
-3.996
-8.92%
jan 1, 1994
43.355
+2.555
6.26%
jan 1, 1995
42.302
-1.053
-2.43%
jan 1, 1996
40.667
-1.635
-3.86%
jan 1, 1997
45.914
+5.247
12.9%
jan 1, 1998
49.285
+3.372
7.34%
jan 1, 1999
53.174
+3.889
7.89%
jan 1, 2000
49.191
-3.983
-7.49%
jan 1, 2001
45.87
-3.321
-6.75%
jan 1, 2002
45.811
-0.059
-0.13%
jan 1, 2003
47.303
+1.492
3.26%
jan 1, 2004
37.144
-10.159
-21.48%
jan 1, 2005
36.404
-0.74
-1.99%
jan 1, 2006
40.97
+4.566
12.54%
jan 1, 2007
42.595
+1.625
3.97%
jan 1, 2008
40.249
-2.346
-5.51%
jan 1, 2009
36.616
-3.633
-9.03%
jan 1, 2010
62.052
+25.436
69.47%
jan 1, 2011
53.815
-8.237
-13.27%
jan 1, 2012
47.006
-6.809
-12.65%
jan 1, 2013
56.043
+9.038
19.23%
jan 1, 2014
56.104
+0.061
0.11%
jan 1, 2015
61.056
+4.952
8.83%
jan 1, 2016
68.947
+7.891
12.92%
Ranking of countries by current statistics by years


Comments: