29
/
en
AIzaSyAYiBZKx7MnpbEhh9jyipgxe19OcubqV5w
April 1, 2024
231991
Samoa
WSM
true
2
1
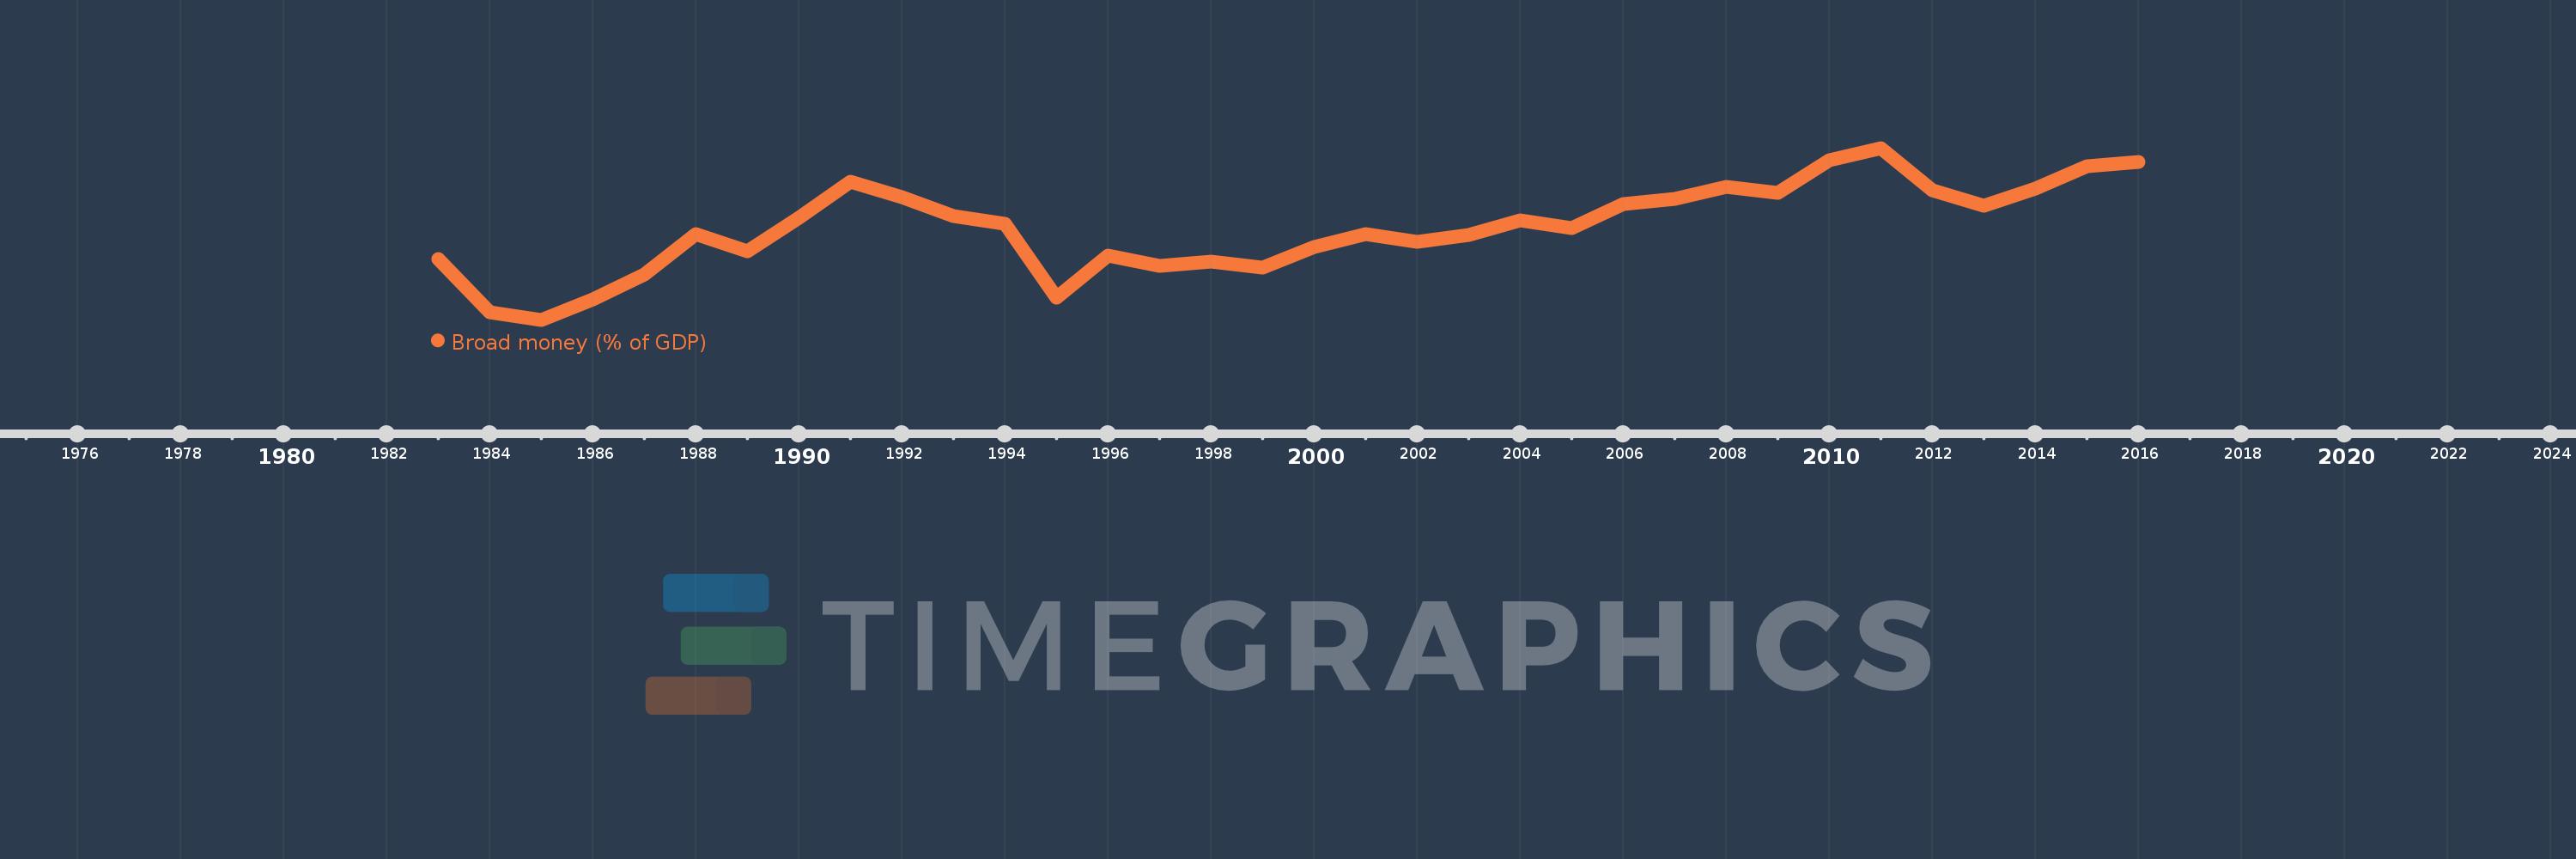
Broad money (% of GDP)
2016,2015,2014,2013,2012,2011,2010,2009,2008,2007,2006,2005,2004,2003,2002,2001,2000,1999,1998,1997,1996,1995,1994,1993,1992,1991,1990,1989,1988,1987,1986,1985,1984,1983
This statistics in other country:
AfghanistanAlbaniaAlgeriaAngolaAntigua and BarbudaArab WorldArgentinaArmeniaArubaAustraliaAzerbaijanBahamas, TheBahrainBangladeshBarbadosBelarusBelizeBeninBhutanBoliviaBosnia and HerzegovinaBotswanaBrazilBrunei DarussalamBulgariaBurkina FasoBurundiCabo VerdeCambodiaCameroonCanadaCaribbean small statesCentral African RepublicCentral Europe and the BalticsChadChileChinaColombiaComorosCongo, Dem. Rep.Congo, Rep.Costa RicaCote d'IvoireCroatiaCzech RepublicDenmarkDjiboutiDominicaDominican RepublicEarly-demographic dividendEast Asia & PacificEast Asia & Pacific (excluding high income)East Asia & Pacific (IDA & IBRD countries)EcuadorEgypt, Arab Rep.El SalvadorEquatorial GuineaEritreaEstoniaEthiopiaEurope & Central Asia (excluding high income)Europe & Central Asia (IDA & IBRD countries)FijiFragile and conflict affected situationsGabonGambia, TheGeorgiaGhanaGrenadaGuatemalaGuineaGuinea-BissauGuyanaHaitiHeavily indebted poor countries (HIPC)High incomeHondurasHong Kong SAR, ChinaHungaryIBRD onlyIcelandIDA & IBRD totalIDA blendIDA onlyIDA totalIndiaIndonesiaIran, Islamic Rep.IraqIsraelJamaicaJapanJordanKazakhstanKenyaKorea, Rep.KuwaitKyrgyz RepublicLao PDRLate-demographic dividendLatin America & Caribbean Latin America & Caribbean (excluding high income)Latin America & the Caribbean (IDA & IBRD countries)LatviaLeast developed countries: UN classificationLebanonLesothoLiberiaLibyaLithuaniaLow & middle incomeLow incomeLower middle incomeMacao SAR, ChinaMacedonia, FYRMadagascarMalawiMalaysiaMaldivesMaliMauritaniaMauritiusMexicoMicronesia, Fed. Sts.Middle East & North AfricaMiddle East & North Africa (excluding high income)Middle East & North Africa (IDA & IBRD countries)Middle incomeMoldovaMongoliaMoroccoMozambiqueMyanmarNamibiaNepalNew ZealandNicaraguaNigerNigeriaNorth AmericaNorwayOECD membersOmanOther small statesPacific island small statesPakistanPanamaPapua New GuineaParaguayPeruPhilippinesPolandPost-demographic dividendPre-demographic dividendQatarRomaniaRussian FederationRwandaSamoaSao Tome and PrincipeSaudi ArabiaSenegalSerbiaSeychellesSierra LeoneSingaporeSlovak RepublicSmall statesSolomon IslandsSouth AfricaSouth AsiaSouth Asia (IDA & IBRD)South SudanSri LankaSt. Kitts and NevisSt. LuciaSt. Vincent and the GrenadinesSub-Saharan Africa Sub-Saharan Africa (excluding high income)Sub-Saharan Africa (IDA & IBRD countries)SudanSurinameSwazilandSwedenSwitzerlandSyrian Arab RepublicTajikistanTanzaniaThailandTimor-LesteTogoTongaTrinidad and TobagoTunisiaTurkeyUgandaUkraineUnited Arab EmiratesUnited KingdomUnited StatesUpper middle incomeUruguayVanuatuVenezuela, RBVietnamWest Bank and GazaWorldYemen, Rep.ZambiaZimbabwe Timeline:
This timeline shows a graph from 1983 to 2016 of Samoa. No data until 1982. Number of actual observations by date: 34.
Source name:
World Development Indicators
Source organization:
International Monetary Fund, International Financial Statistics and data files, and World Bank and OECD GDP estimates.
Categories, topics:
Financial Sector
Last updated:
apr 23, 2017
Indicators value changes by year
Minimum:
21.395
jan 1, 1985
Maximum:
46.606
jan 1, 2011
At the date of observation
Value
Absolute change
Change from previous value
jan 1, 1983
30.276
+30.276
0.0%
jan 1, 1984
22.439
-7.837
-25.89%
jan 1, 1985
21.395
-1.044
-4.65%
jan 1, 1986
24.419
+3.024
14.14%
jan 1, 1987
27.98
+3.561
14.58%
jan 1, 1988
34.025
+6.045
21.6%
jan 1, 1989
31.431
-2.593
-7.62%
jan 1, 1990
36.39
+4.959
15.78%
jan 1, 1991
41.652
+5.262
14.46%
jan 1, 1992
39.423
-2.229
-5.35%
jan 1, 1993
36.646
-2.777
-7.04%
jan 1, 1994
35.477
-1.169
-3.19%
jan 1, 1995
24.636
-10.841
-30.56%
jan 1, 1996
30.873
+6.237
25.32%
jan 1, 1997
29.272
-1.601
-5.19%
jan 1, 1998
29.946
+0.675
2.31%
jan 1, 1999
29.04
-0.907
-3.03%
jan 1, 2000
32.091
+3.052
10.51%
jan 1, 2001
33.933
+1.842
5.74%
jan 1, 2002
32.87
-1.064
-3.13%
jan 1, 2003
33.894
+1.024
3.12%
jan 1, 2004
36.014
+2.12
6.26%
jan 1, 2005
34.842
-1.172
-3.25%
jan 1, 2006
38.358
+3.516
10.09%
jan 1, 2007
39.162
+0.804
2.1%
jan 1, 2008
40.944
+1.782
4.55%
jan 1, 2009
40.075
-0.869
-2.12%
jan 1, 2010
44.763
+4.688
11.7%
jan 1, 2011
46.606
+1.843
4.12%
jan 1, 2012
40.422
-6.184
-13.27%
jan 1, 2013
38.09
-2.332
-5.77%
jan 1, 2014
40.626
+2.536
6.66%
jan 1, 2015
43.877
+3.25
8.0%
jan 1, 2016
44.558
+0.682
1.55%
Ranking of countries by current statistics by years


Comments: