29
/
en
AIzaSyAYiBZKx7MnpbEhh9jyipgxe19OcubqV5w
April 1, 2024
162251
Jamaica
JAM
true
2
1
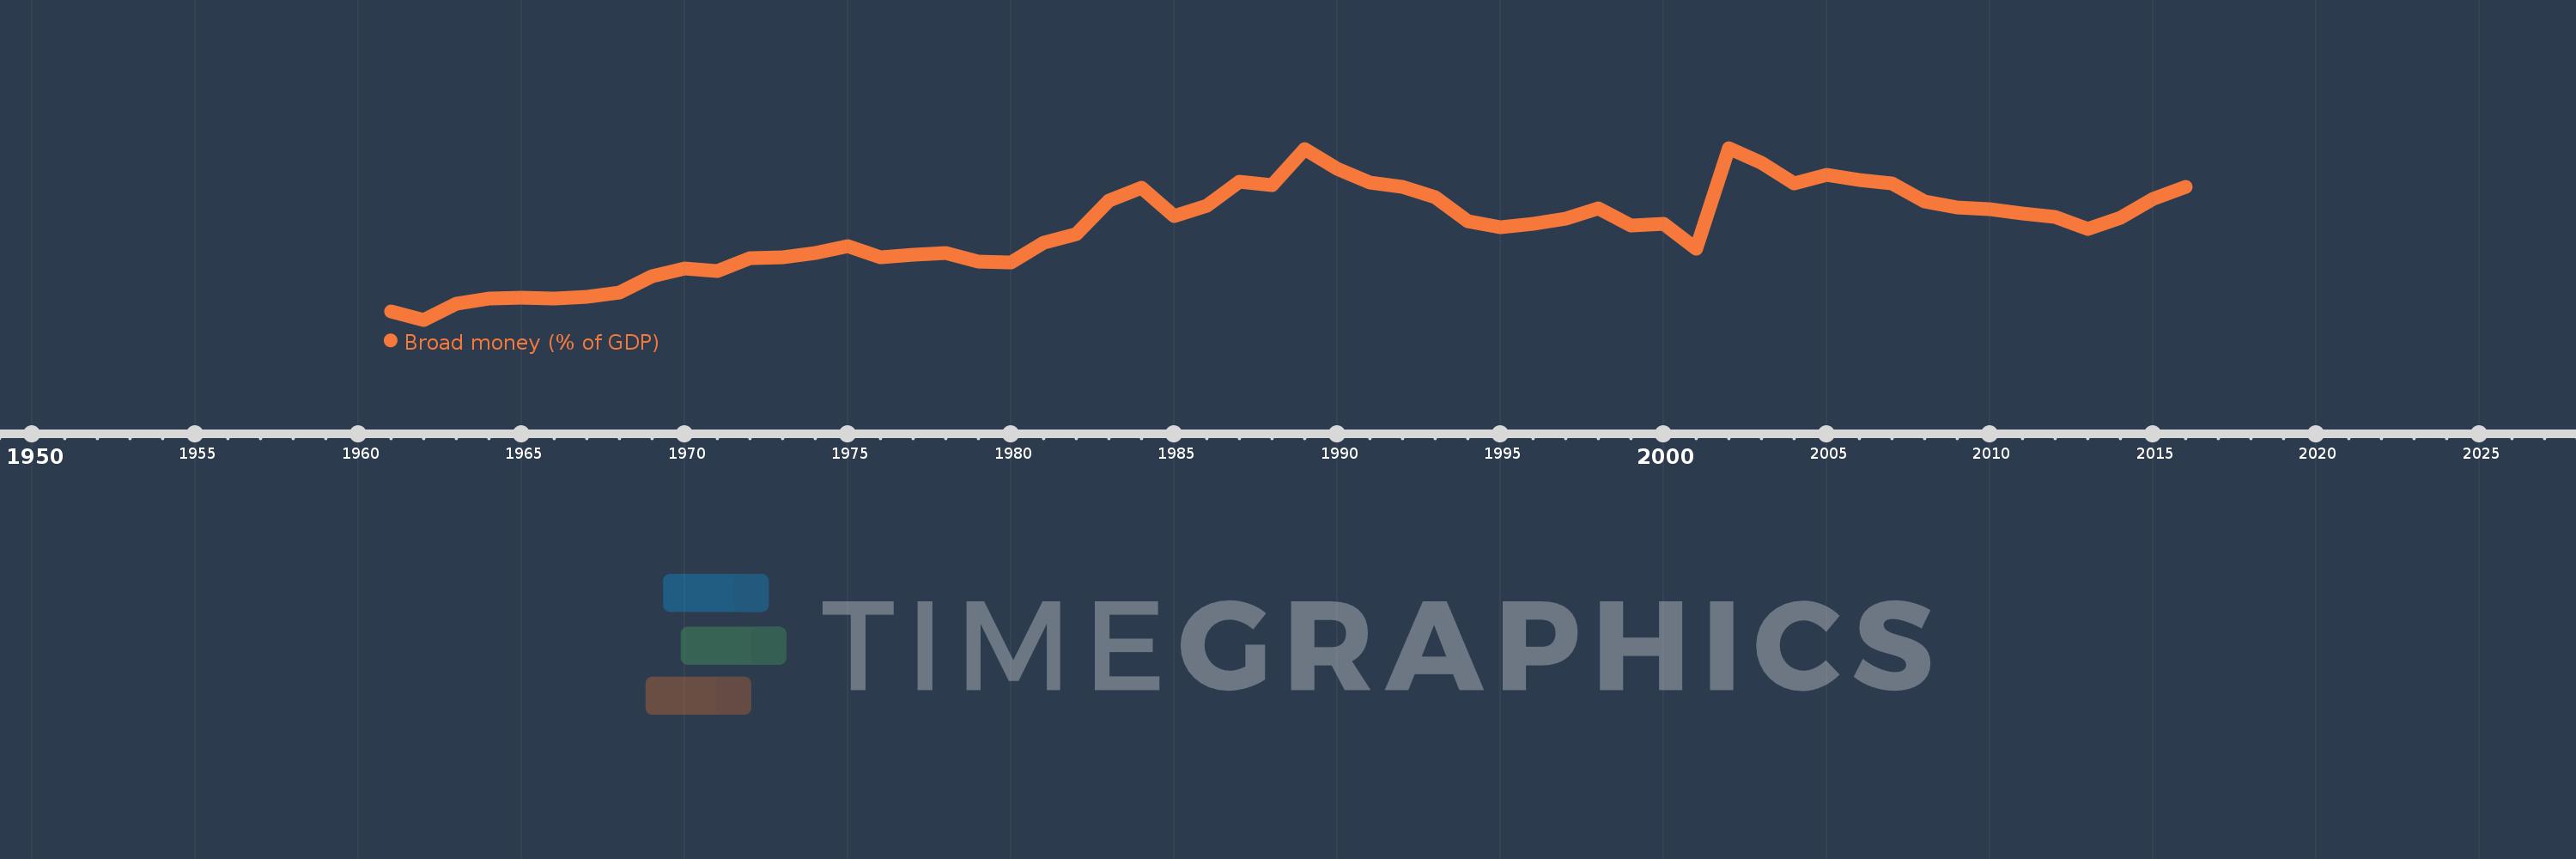
Broad money (% of GDP)
2016,2015,2014,2013,2012,2011,2010,2009,2008,2007,2006,2005,2004,2003,2002,2001,2000,1999,1998,1997,1996,1995,1994,1993,1992,1991,1990,1989,1988,1987,1986,1985,1984,1983,1982,1981,1980,1979,1978,1977,1976,1975,1974,1973,1972,1971,1970,1969,1968,1967,1966,1965,1964,1963,1962,1961
This statistics in other country:
AfghanistanAlbaniaAlgeriaAngolaAntigua and BarbudaArab WorldArgentinaArmeniaArubaAustraliaAzerbaijanBahamas, TheBahrainBangladeshBarbadosBelarusBelizeBeninBhutanBoliviaBosnia and HerzegovinaBotswanaBrazilBrunei DarussalamBulgariaBurkina FasoBurundiCabo VerdeCambodiaCameroonCanadaCaribbean small statesCentral African RepublicCentral Europe and the BalticsChadChileChinaColombiaComorosCongo, Dem. Rep.Congo, Rep.Costa RicaCote d'IvoireCroatiaCzech RepublicDenmarkDjiboutiDominicaDominican RepublicEarly-demographic dividendEast Asia & PacificEast Asia & Pacific (excluding high income)East Asia & Pacific (IDA & IBRD countries)EcuadorEgypt, Arab Rep.El SalvadorEquatorial GuineaEritreaEstoniaEthiopiaEurope & Central Asia (excluding high income)Europe & Central Asia (IDA & IBRD countries)FijiFragile and conflict affected situationsGabonGambia, TheGeorgiaGhanaGrenadaGuatemalaGuineaGuinea-BissauGuyanaHaitiHeavily indebted poor countries (HIPC)High incomeHondurasHong Kong SAR, ChinaHungaryIBRD onlyIcelandIDA & IBRD totalIDA blendIDA onlyIDA totalIndiaIndonesiaIran, Islamic Rep.IraqIsraelJamaicaJapanJordanKazakhstanKenyaKorea, Rep.KuwaitKyrgyz RepublicLao PDRLate-demographic dividendLatin America & Caribbean Latin America & Caribbean (excluding high income)Latin America & the Caribbean (IDA & IBRD countries)LatviaLeast developed countries: UN classificationLebanonLesothoLiberiaLibyaLithuaniaLow & middle incomeLow incomeLower middle incomeMacao SAR, ChinaMacedonia, FYRMadagascarMalawiMalaysiaMaldivesMaliMauritaniaMauritiusMexicoMicronesia, Fed. Sts.Middle East & North AfricaMiddle East & North Africa (excluding high income)Middle East & North Africa (IDA & IBRD countries)Middle incomeMoldovaMongoliaMoroccoMozambiqueMyanmarNamibiaNepalNew ZealandNicaraguaNigerNigeriaNorth AmericaNorwayOECD membersOmanOther small statesPacific island small statesPakistanPanamaPapua New GuineaParaguayPeruPhilippinesPolandPost-demographic dividendPre-demographic dividendQatarRomaniaRussian FederationRwandaSamoaSao Tome and PrincipeSaudi ArabiaSenegalSerbiaSeychellesSierra LeoneSingaporeSlovak RepublicSmall statesSolomon IslandsSouth AfricaSouth AsiaSouth Asia (IDA & IBRD)South SudanSri LankaSt. Kitts and NevisSt. LuciaSt. Vincent and the GrenadinesSub-Saharan Africa Sub-Saharan Africa (excluding high income)Sub-Saharan Africa (IDA & IBRD countries)SudanSurinameSwazilandSwedenSwitzerlandSyrian Arab RepublicTajikistanTanzaniaThailandTimor-LesteTogoTongaTrinidad and TobagoTunisiaTurkeyUgandaUkraineUnited Arab EmiratesUnited KingdomUnited StatesUpper middle incomeUruguayVanuatuVenezuela, RBVietnamWest Bank and GazaWorldYemen, Rep.ZambiaZimbabwe Timeline:
This timeline shows a graph from 1961 to 2016 of Jamaica. No data until 1960. Number of actual observations by date: 56.
Source name:
World Development Indicators
Source organization:
International Monetary Fund, International Financial Statistics and data files, and World Bank and OECD GDP estimates.
Categories, topics:
Financial Sector
Last updated:
apr 23, 2017
Indicators value changes by year
Minimum:
17.727
jan 1, 1962
At the date of observation
Value
Absolute change
Change from previous value
jan 1, 1961
20.347
+20.347
0.0%
jan 1, 1962
17.727
-2.62
-12.88%
jan 1, 1963
22.818
+5.091
28.72%
jan 1, 1964
24.44
+1.623
7.11%
jan 1, 1965
24.793
+0.352
1.44%
jan 1, 1966
24.64
-0.153
-0.62%
jan 1, 1967
25.143
+0.503
2.04%
jan 1, 1968
26.481
+1.339
5.32%
jan 1, 1969
31.721
+5.239
19.79%
jan 1, 1970
34.158
+2.438
7.69%
jan 1, 1971
33.344
-0.814
-2.38%
jan 1, 1972
37.605
+4.261
12.78%
jan 1, 1973
37.837
+0.232
0.62%
jan 1, 1974
39.099
+1.261
3.33%
jan 1, 1975
41.435
+2.337
5.98%
jan 1, 1976
37.811
-3.624
-8.75%
jan 1, 1977
38.554
+0.742
1.96%
jan 1, 1978
39.365
+0.811
2.1%
jan 1, 1979
36.413
-2.952
-7.5%
jan 1, 1980
36.128
-0.285
-0.78%
jan 1, 1981
42.665
+6.537
18.09%
jan 1, 1982
45.342
+2.678
6.28%
jan 1, 1983
56.048
+10.706
23.61%
jan 1, 1984
60.157
+4.109
7.33%
jan 1, 1985
51.12
-9.036
-15.02%
jan 1, 1986
54.404
+3.284
6.42%
jan 1, 1987
62.113
+7.709
14.17%
jan 1, 1988
61.092
-1.021
-1.64%
jan 1, 1989
72.648
+11.556
18.92%
jan 1, 1990
66.42
-6.228
-8.57%
jan 1, 1991
61.952
-4.469
-6.73%
jan 1, 1992
60.522
-1.43
-2.31%
jan 1, 1993
57.274
-3.248
-5.37%
jan 1, 1994
49.471
-7.803
-13.62%
jan 1, 1995
47.511
-1.96
-3.96%
jan 1, 1996
48.629
+1.119
2.35%
jan 1, 1997
50.187
+1.557
3.2%
jan 1, 1998
53.501
+3.314
6.6%
jan 1, 1999
48.055
-5.446
-10.18%
jan 1, 2000
48.613
+0.558
1.16%
jan 1, 2001
40.537
-8.076
-16.61%
jan 1, 2002
73.09
+32.553
80.3%
jan 1, 2003
68.208
-4.882
-6.68%
jan 1, 2004
61.536
-6.672
-9.78%
jan 1, 2005
64.312
+2.776
4.51%
jan 1, 2006
62.696
-1.616
-2.51%
jan 1, 2007
61.591
-1.105
-1.76%
jan 1, 2008
55.881
-5.71
-9.27%
jan 1, 2009
53.958
-1.923
-3.44%
jan 1, 2010
53.264
-0.694
-1.29%
jan 1, 2011
52.073
-1.191
-2.24%
jan 1, 2012
50.895
-1.178
-2.26%
jan 1, 2013
47.064
-3.83
-7.53%
jan 1, 2014
50.621
+3.556
7.56%
jan 1, 2015
56.588
+5.967
11.79%
jan 1, 2016
60.499
+3.911
6.91%
Ranking of countries by current statistics by years


Comments: