29
/
en
AIzaSyAYiBZKx7MnpbEhh9jyipgxe19OcubqV5w
April 1, 2024
245274
South Africa
ZAF
true
2
1
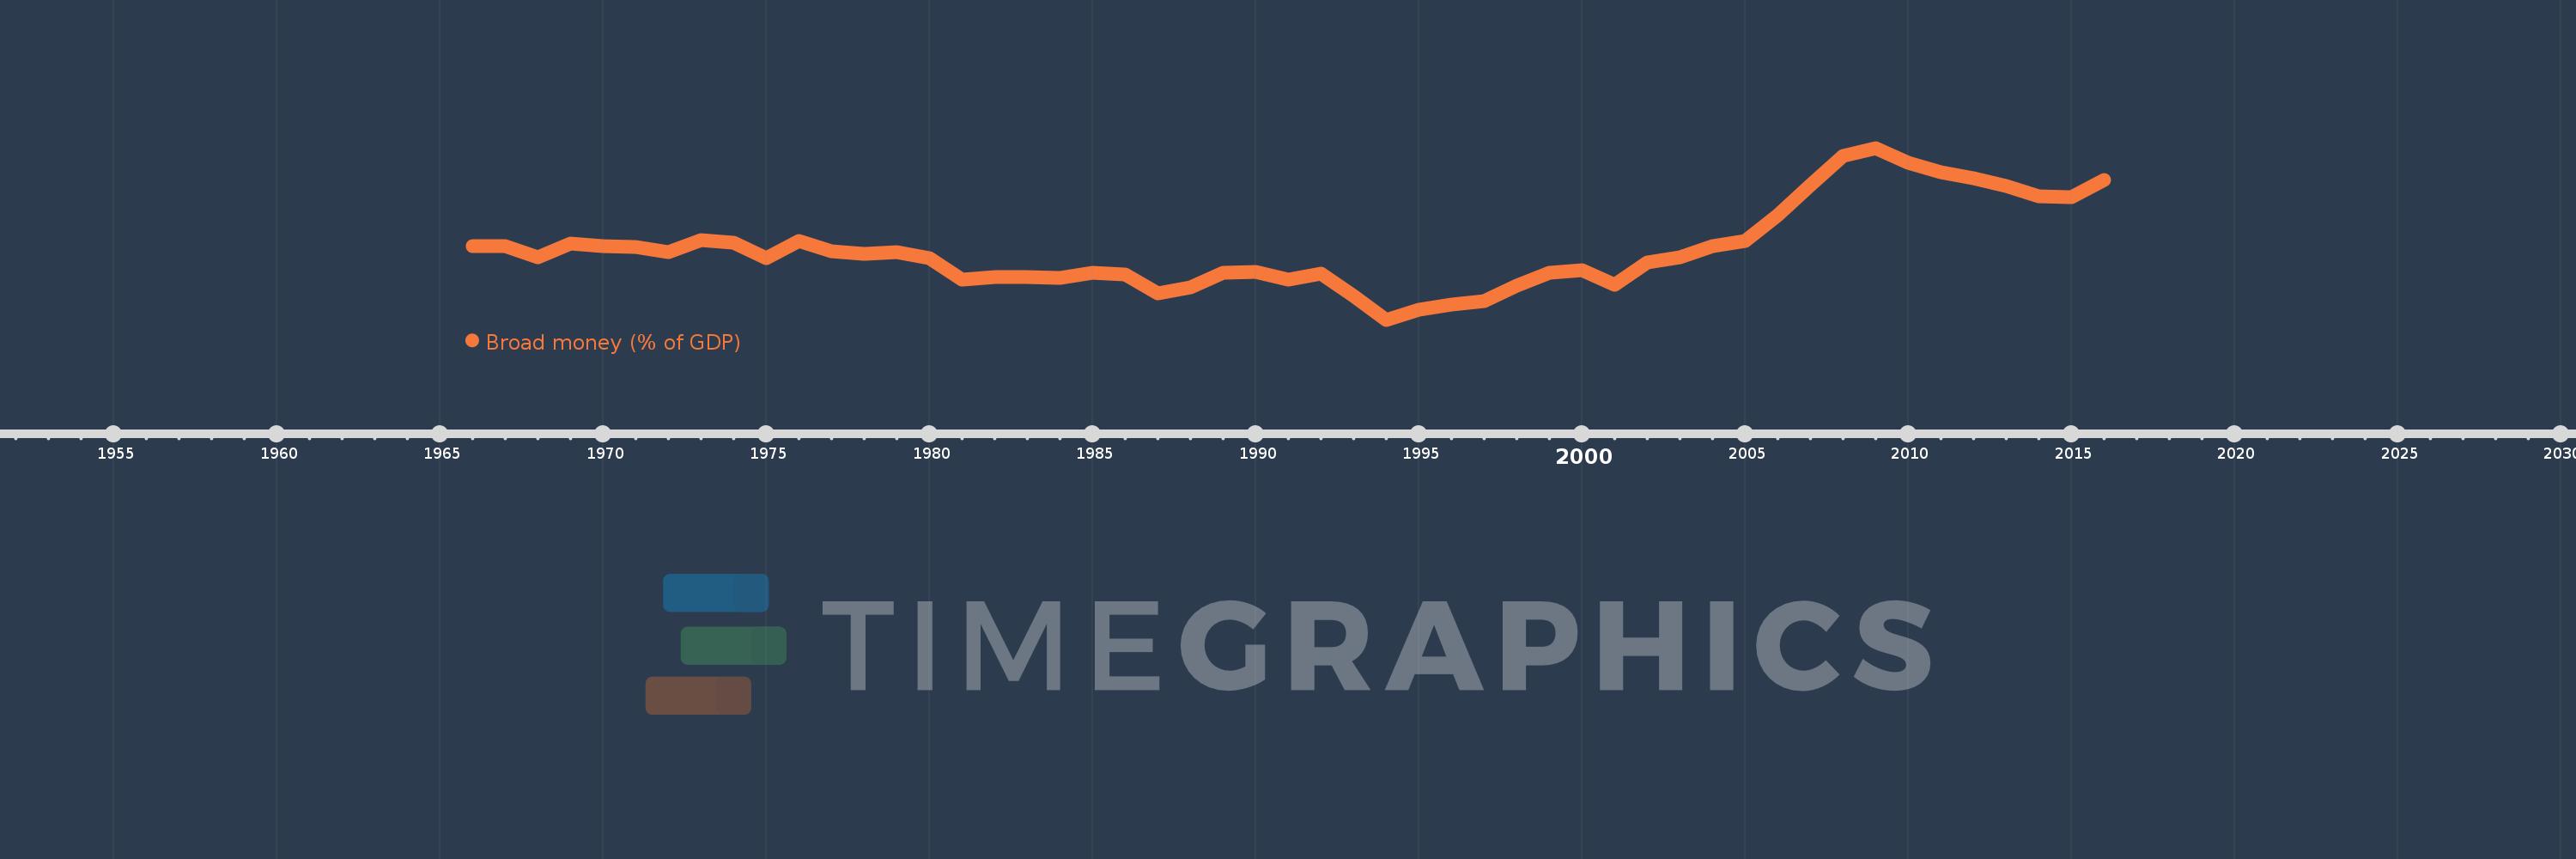
Broad money (% of GDP)
2016,2015,2014,2013,2012,2011,2010,2009,2008,2007,2006,2005,2004,2003,2002,2001,2000,1999,1998,1997,1996,1995,1994,1993,1992,1991,1990,1989,1988,1987,1986,1985,1984,1983,1982,1981,1980,1979,1978,1977,1976,1975,1974,1973,1972,1971,1970,1969,1968,1967,1966
This statistics in other country:
AfghanistanAlbaniaAlgeriaAngolaAntigua and BarbudaArab WorldArgentinaArmeniaArubaAustraliaAzerbaijanBahamas, TheBahrainBangladeshBarbadosBelarusBelizeBeninBhutanBoliviaBosnia and HerzegovinaBotswanaBrazilBrunei DarussalamBulgariaBurkina FasoBurundiCabo VerdeCambodiaCameroonCanadaCaribbean small statesCentral African RepublicCentral Europe and the BalticsChadChileChinaColombiaComorosCongo, Dem. Rep.Congo, Rep.Costa RicaCote d'IvoireCroatiaCzech RepublicDenmarkDjiboutiDominicaDominican RepublicEarly-demographic dividendEast Asia & PacificEast Asia & Pacific (excluding high income)East Asia & Pacific (IDA & IBRD countries)EcuadorEgypt, Arab Rep.El SalvadorEquatorial GuineaEritreaEstoniaEthiopiaEurope & Central Asia (excluding high income)Europe & Central Asia (IDA & IBRD countries)FijiFragile and conflict affected situationsGabonGambia, TheGeorgiaGhanaGrenadaGuatemalaGuineaGuinea-BissauGuyanaHaitiHeavily indebted poor countries (HIPC)High incomeHondurasHong Kong SAR, ChinaHungaryIBRD onlyIcelandIDA & IBRD totalIDA blendIDA onlyIDA totalIndiaIndonesiaIran, Islamic Rep.IraqIsraelJamaicaJapanJordanKazakhstanKenyaKorea, Rep.KuwaitKyrgyz RepublicLao PDRLate-demographic dividendLatin America & Caribbean Latin America & Caribbean (excluding high income)Latin America & the Caribbean (IDA & IBRD countries)LatviaLeast developed countries: UN classificationLebanonLesothoLiberiaLibyaLithuaniaLow & middle incomeLow incomeLower middle incomeMacao SAR, ChinaMacedonia, FYRMadagascarMalawiMalaysiaMaldivesMaliMauritaniaMauritiusMexicoMicronesia, Fed. Sts.Middle East & North AfricaMiddle East & North Africa (excluding high income)Middle East & North Africa (IDA & IBRD countries)Middle incomeMoldovaMongoliaMoroccoMozambiqueMyanmarNamibiaNepalNew ZealandNicaraguaNigerNigeriaNorth AmericaNorwayOECD membersOmanOther small statesPacific island small statesPakistanPanamaPapua New GuineaParaguayPeruPhilippinesPolandPost-demographic dividendPre-demographic dividendQatarRomaniaRussian FederationRwandaSamoaSao Tome and PrincipeSaudi ArabiaSenegalSerbiaSeychellesSierra LeoneSingaporeSlovak RepublicSmall statesSolomon IslandsSouth AfricaSouth AsiaSouth Asia (IDA & IBRD)South SudanSri LankaSt. Kitts and NevisSt. LuciaSt. Vincent and the GrenadinesSub-Saharan Africa Sub-Saharan Africa (excluding high income)Sub-Saharan Africa (IDA & IBRD countries)SudanSurinameSwazilandSwedenSwitzerlandSyrian Arab RepublicTajikistanTanzaniaThailandTimor-LesteTogoTongaTrinidad and TobagoTunisiaTurkeyUgandaUkraineUnited Arab EmiratesUnited KingdomUnited StatesUpper middle incomeUruguayVanuatuVenezuela, RBVietnamWest Bank and GazaWorldYemen, Rep.ZambiaZimbabwe Timeline:
This timeline shows a graph from 1966 to 2016 of South Africa. No data until 1965. Number of actual observations by date: 51.
Source name:
World Development Indicators
Source organization:
International Monetary Fund, International Financial Statistics and data files, and World Bank and OECD GDP estimates.
Categories, topics:
Financial Sector
Last updated:
apr 23, 2017
Indicators value changes by year
At the date of observation
Value
Absolute change
Change from previous value
jan 1, 1966
60.674
+60.674
0.0%
jan 1, 1967
60.603
-0.072
-0.12%
jan 1, 1968
58.28
-2.323
-3.83%
jan 1, 1969
61.194
+2.914
5.0%
jan 1, 1970
60.655
-0.54
-0.88%
jan 1, 1971
60.467
-0.188
-0.31%
jan 1, 1972
59.328
-1.139
-1.88%
jan 1, 1973
61.872
+2.544
4.29%
jan 1, 1974
61.355
-0.517
-0.84%
jan 1, 1975
58.2
-3.155
-5.14%
jan 1, 1976
61.763
+3.564
6.12%
jan 1, 1977
59.533
-2.231
-3.61%
jan 1, 1978
58.987
-0.546
-0.92%
jan 1, 1979
59.476
+0.489
0.83%
jan 1, 1980
58.18
-1.296
-2.18%
jan 1, 1981
53.665
-4.514
-7.76%
jan 1, 1982
54.307
+0.642
1.2%
jan 1, 1983
54.312
+0.005
0.01%
jan 1, 1984
54.032
-0.28
-0.51%
jan 1, 1985
55.23
+1.198
2.22%
jan 1, 1986
54.864
-0.366
-0.66%
jan 1, 1987
50.98
-3.884
-7.08%
jan 1, 1988
52.123
+1.143
2.24%
jan 1, 1989
55.161
+3.038
5.83%
jan 1, 1990
55.392
+0.231
0.42%
jan 1, 1991
53.804
-1.587
-2.87%
jan 1, 1992
55.008
+1.204
2.24%
jan 1, 1993
50.464
-4.544
-8.26%
jan 1, 1994
45.5
-4.964
-9.84%
jan 1, 1995
47.612
+2.112
4.64%
jan 1, 1996
48.618
+1.006
2.11%
jan 1, 1997
49.367
+0.749
1.54%
jan 1, 1998
52.494
+3.127
6.33%
jan 1, 1999
55.076
+2.581
4.92%
jan 1, 2000
55.734
+0.659
1.2%
jan 1, 2001
52.711
-3.024
-5.43%
jan 1, 2002
57.308
+4.597
8.72%
jan 1, 2003
58.258
+0.95
1.66%
jan 1, 2004
60.631
+2.373
4.07%
jan 1, 2005
61.597
+0.966
1.59%
jan 1, 2006
66.97
+5.373
8.72%
jan 1, 2007
73.185
+6.215
9.28%
jan 1, 2008
79.086
+5.901
8.06%
jan 1, 2009
80.8
+1.714
2.17%
jan 1, 2010
77.678
-3.122
-3.86%
jan 1, 2011
75.8
-1.878
-2.42%
jan 1, 2012
74.636
-1.164
-1.54%
jan 1, 2013
72.94
-1.696
-2.27%
jan 1, 2014
70.83
-2.11
-2.89%
jan 1, 2015
70.735
-0.095
-0.13%
jan 1, 2016
74.13
+3.395
4.8%
Ranking of countries by current statistics by years


Comments: