29
/
en
AIzaSyAYiBZKx7MnpbEhh9jyipgxe19OcubqV5w
April 1, 2024
202606
Mozambique
MOZ
true
2
1
Broad money (% of GDP)
2016,2015,2014,2013,2012,2011,2010,2009,2008,2007,2006,2005,2004,2003,2002,2001,2000,1999,1998,1997,1996,1995,1994,1993,1992,1991,1990
This statistics in other country:
AfghanistanAlbaniaAlgeriaAngolaAntigua and BarbudaArab WorldArgentinaArmeniaArubaAustraliaAzerbaijanBahamas, TheBahrainBangladeshBarbadosBelarusBelizeBeninBhutanBoliviaBosnia and HerzegovinaBotswanaBrazilBrunei DarussalamBulgariaBurkina FasoBurundiCabo VerdeCambodiaCameroonCanadaCaribbean small statesCentral African RepublicCentral Europe and the BalticsChadChileChinaColombiaComorosCongo, Dem. Rep.Congo, Rep.Costa RicaCote d'IvoireCroatiaCzech RepublicDenmarkDjiboutiDominicaDominican RepublicEarly-demographic dividendEast Asia & PacificEast Asia & Pacific (excluding high income)East Asia & Pacific (IDA & IBRD countries)EcuadorEgypt, Arab Rep.El SalvadorEquatorial GuineaEritreaEstoniaEthiopiaEurope & Central Asia (excluding high income)Europe & Central Asia (IDA & IBRD countries)FijiFragile and conflict affected situationsGabonGambia, TheGeorgiaGhanaGrenadaGuatemalaGuineaGuinea-BissauGuyanaHaitiHeavily indebted poor countries (HIPC)High incomeHondurasHong Kong SAR, ChinaHungaryIBRD onlyIcelandIDA & IBRD totalIDA blendIDA onlyIDA totalIndiaIndonesiaIran, Islamic Rep.IraqIsraelJamaicaJapanJordanKazakhstanKenyaKorea, Rep.KuwaitKyrgyz RepublicLao PDRLate-demographic dividendLatin America & Caribbean Latin America & Caribbean (excluding high income)Latin America & the Caribbean (IDA & IBRD countries)LatviaLeast developed countries: UN classificationLebanonLesothoLiberiaLibyaLithuaniaLow & middle incomeLow incomeLower middle incomeMacao SAR, ChinaMacedonia, FYRMadagascarMalawiMalaysiaMaldivesMaliMauritaniaMauritiusMexicoMicronesia, Fed. Sts.Middle East & North AfricaMiddle East & North Africa (excluding high income)Middle East & North Africa (IDA & IBRD countries)Middle incomeMoldovaMongoliaMoroccoMozambiqueMyanmarNamibiaNepalNew ZealandNicaraguaNigerNigeriaNorth AmericaNorwayOECD membersOmanOther small statesPacific island small statesPakistanPanamaPapua New GuineaParaguayPeruPhilippinesPolandPost-demographic dividendPre-demographic dividendQatarRomaniaRussian FederationRwandaSamoaSao Tome and PrincipeSaudi ArabiaSenegalSerbiaSeychellesSierra LeoneSingaporeSlovak RepublicSmall statesSolomon IslandsSouth AfricaSouth AsiaSouth Asia (IDA & IBRD)South SudanSri LankaSt. Kitts and NevisSt. LuciaSt. Vincent and the GrenadinesSub-Saharan Africa Sub-Saharan Africa (excluding high income)Sub-Saharan Africa (IDA & IBRD countries)SudanSurinameSwazilandSwedenSwitzerlandSyrian Arab RepublicTajikistanTanzaniaThailandTimor-LesteTogoTongaTrinidad and TobagoTunisiaTurkeyUgandaUkraineUnited Arab EmiratesUnited KingdomUnited StatesUpper middle incomeUruguayVanuatuVenezuela, RBVietnamWest Bank and GazaWorldYemen, Rep.ZambiaZimbabwe Timeline:
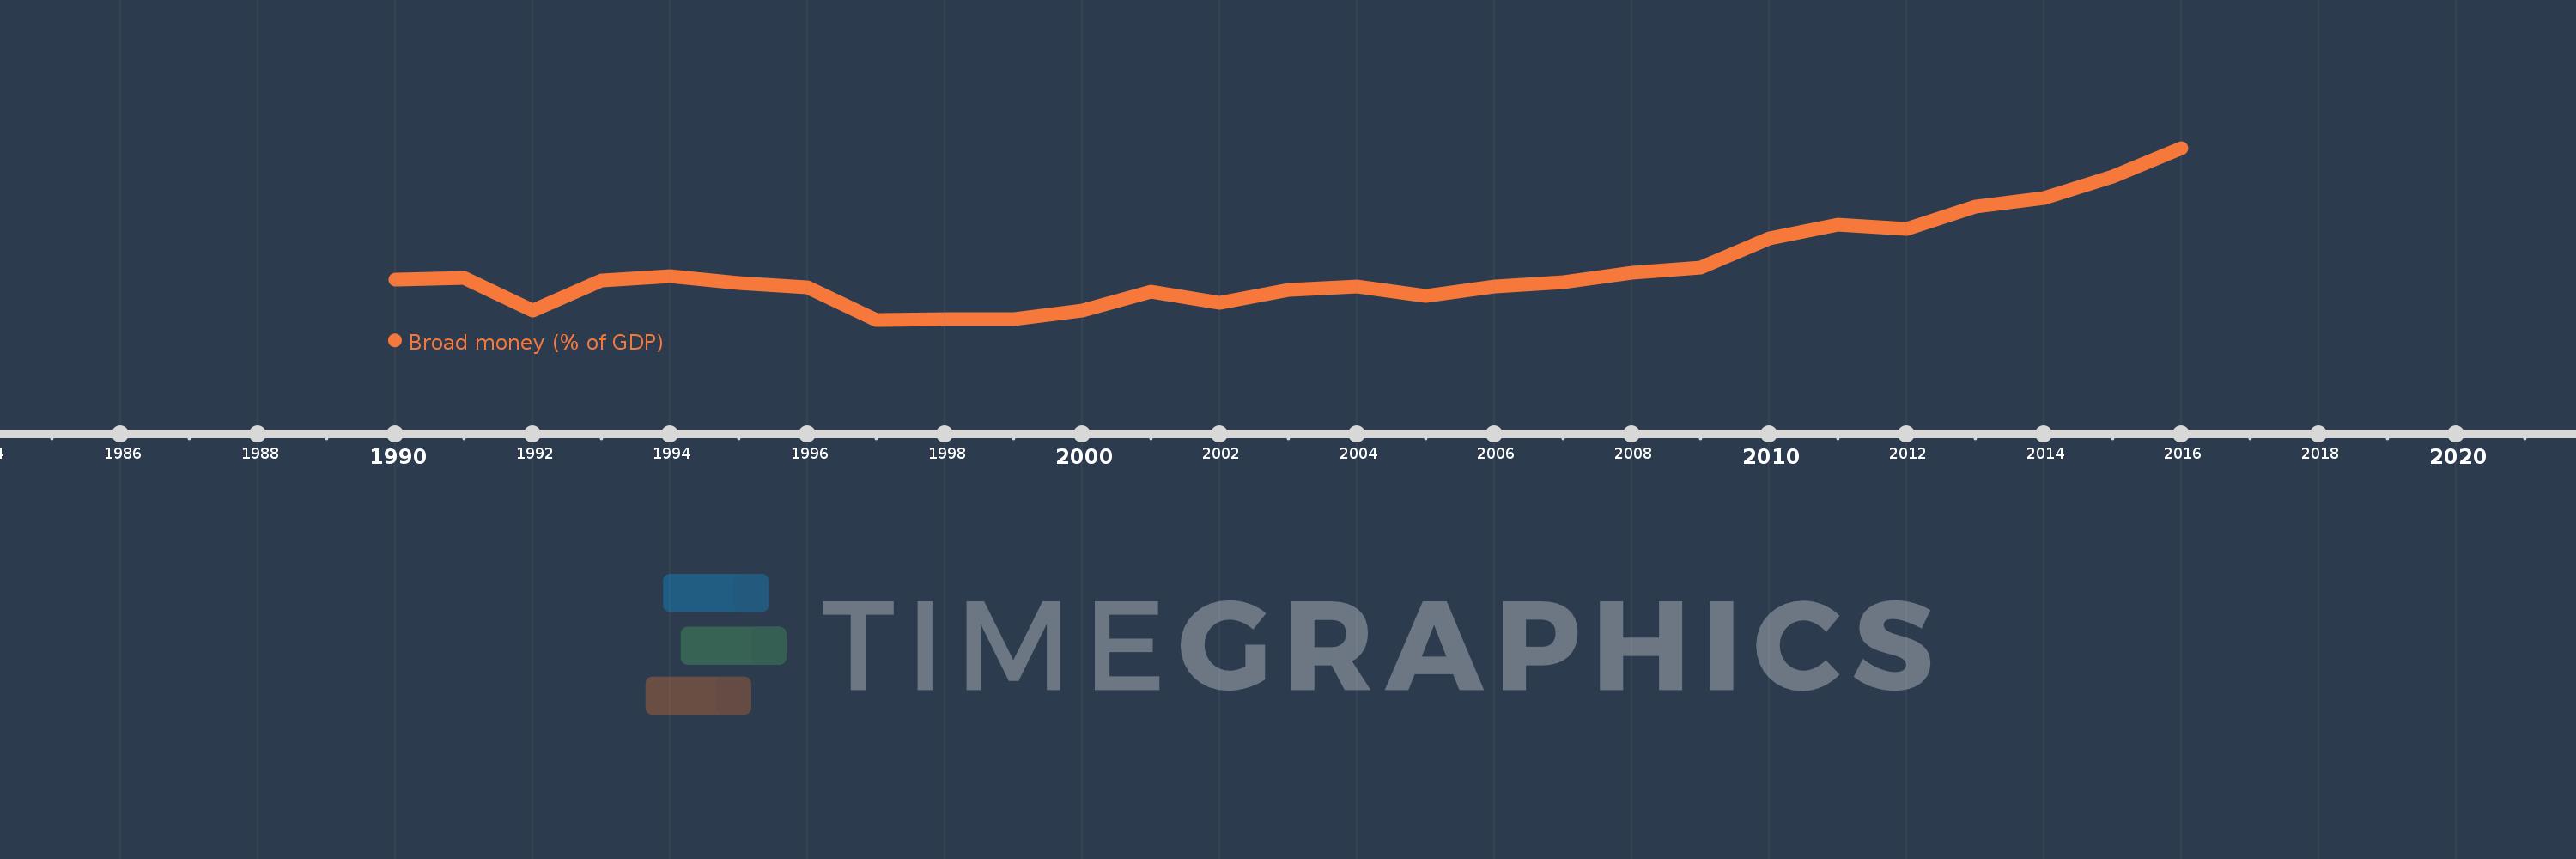
This timeline shows a graph from 1990 to 2016 of Mozambique. No data until 1989. Number of actual observations by date: 27.
Source name:
World Development Indicators
Source organization:
International Monetary Fund, International Financial Statistics and data files, and World Bank and OECD GDP estimates.
Categories, topics:
Financial Sector
Last updated:
apr 23, 2017
Indicators value changes by year
Minimum:
16.918
jan 1, 1997
Maximum:
56.326
jan 1, 2016
At the date of observation
Value
Absolute change
Change from previous value
jan 1, 1990
26.118
+26.118
0.0%
jan 1, 1991
26.471
+0.353
1.35%
jan 1, 1992
19.042
-7.43
-28.07%
jan 1, 1993
25.892
+6.85
35.97%
jan 1, 1994
26.883
+0.991
3.83%
jan 1, 1995
25.251
-1.632
-6.07%
jan 1, 1996
24.352
-0.899
-3.56%
jan 1, 1997
16.918
-7.434
-30.53%
jan 1, 1998
17.095
+0.177
1.05%
jan 1, 1999
16.986
-0.109
-0.64%
jan 1, 2000
19.123
+2.137
12.58%
jan 1, 2001
23.456
+4.333
22.66%
jan 1, 2002
20.859
-2.597
-11.07%
jan 1, 2003
23.702
+2.843
13.63%
jan 1, 2004
24.457
+0.755
3.18%
jan 1, 2005
22.351
-2.106
-8.61%
jan 1, 2006
24.582
+2.231
9.98%
jan 1, 2007
25.578
+0.997
4.06%
jan 1, 2008
27.723
+2.144
8.38%
jan 1, 2009
28.899
+1.176
4.24%
jan 1, 2010
35.659
+6.761
23.39%
jan 1, 2011
38.688
+3.029
8.49%
jan 1, 2012
37.675
-1.013
-2.62%
jan 1, 2013
42.947
+5.272
13.99%
jan 1, 2014
44.88
+1.933
4.5%
jan 1, 2015
49.733
+4.853
10.81%
jan 1, 2016
56.326
+6.593
13.26%
Ranking of countries by current statistics by years


Comments: