29
/
en
AIzaSyAYiBZKx7MnpbEhh9jyipgxe19OcubqV5w
April 1, 2024
26327
Early-demographic dividend
EAR
false
2
1
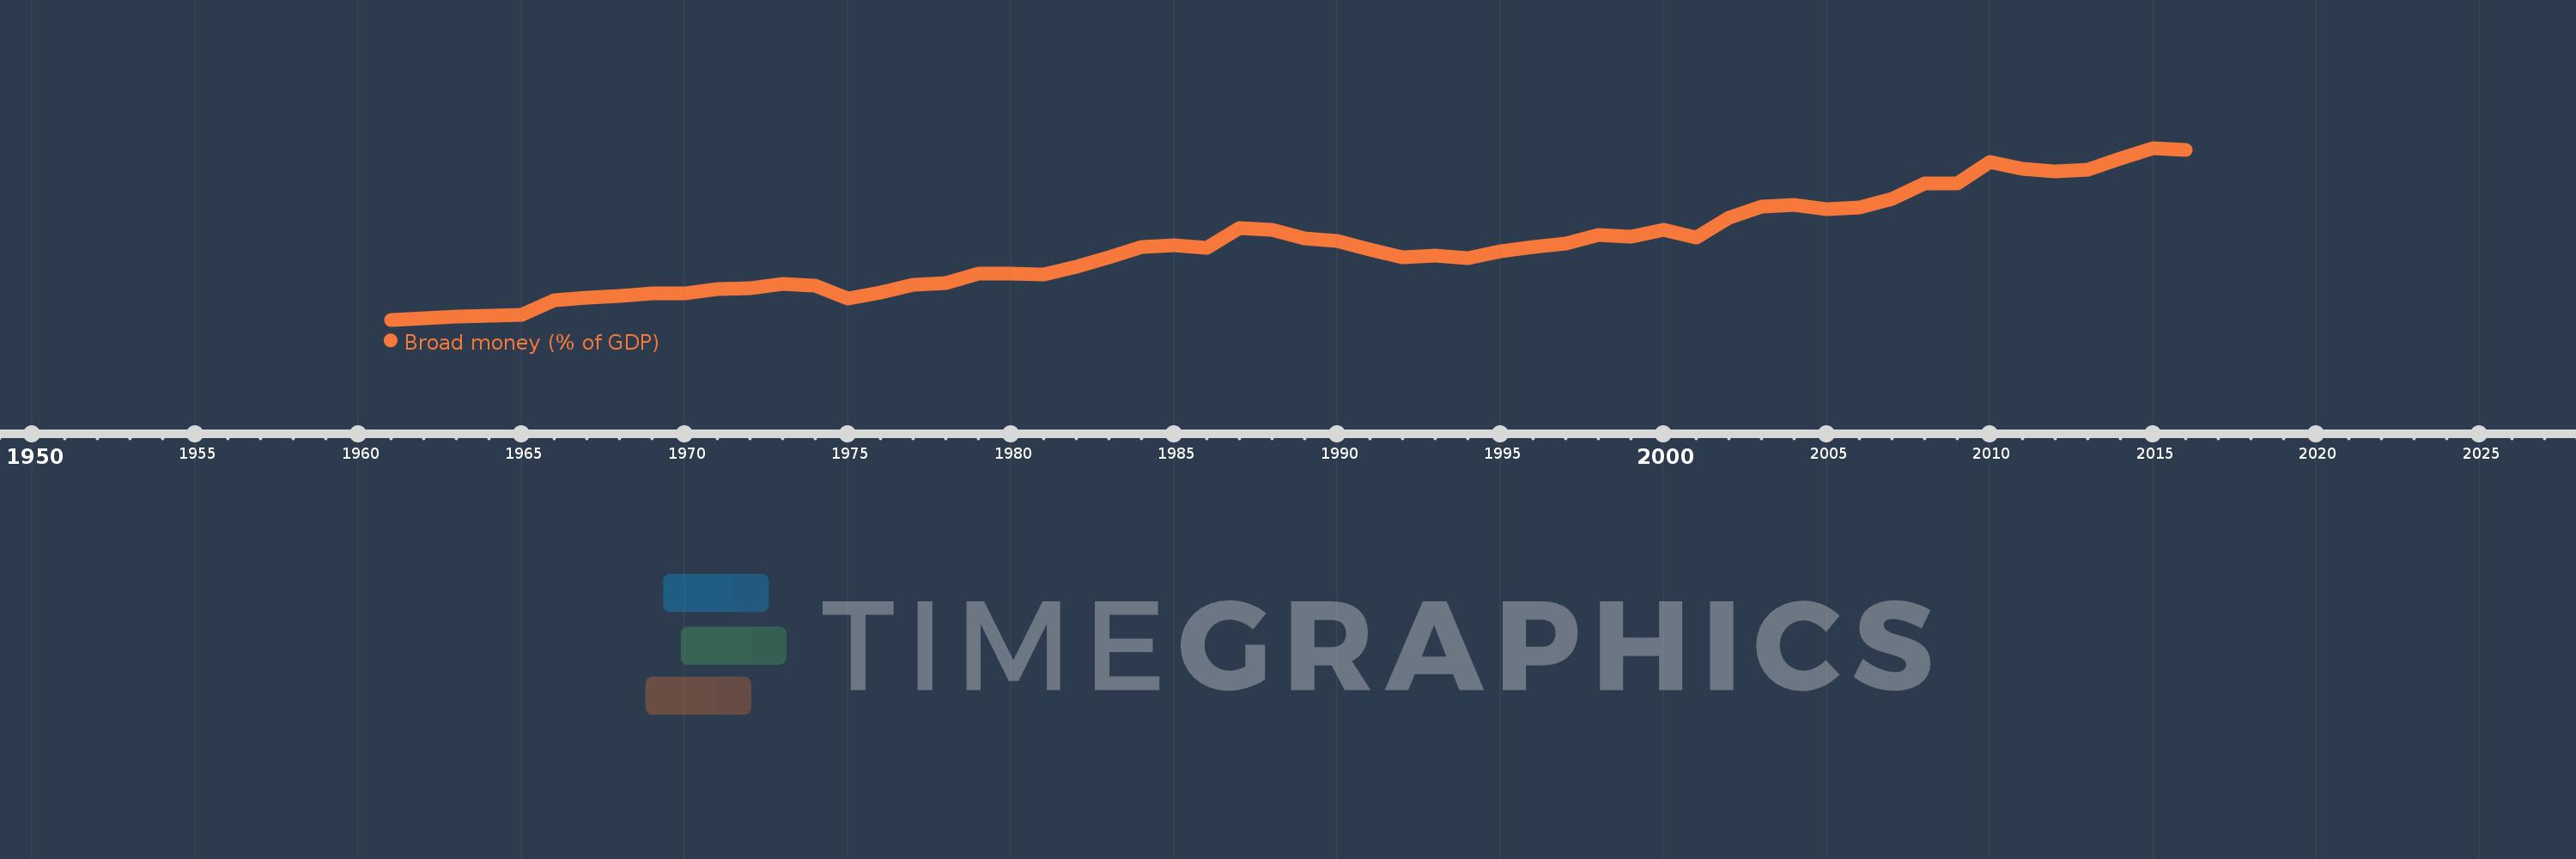
Broad money (% of GDP)
2016,2015,2014,2013,2012,2011,2010,2009,2008,2007,2006,2005,2004,2003,2002,2001,2000,1999,1998,1997,1996,1995,1994,1993,1992,1991,1990,1989,1988,1987,1986,1985,1984,1983,1982,1981,1980,1979,1978,1977,1976,1975,1974,1973,1972,1971,1970,1969,1968,1967,1966,1965,1964,1963,1962,1961
This statistics in other country:
AfghanistanAlbaniaAlgeriaAngolaAntigua and BarbudaArab WorldArgentinaArmeniaArubaAustraliaAzerbaijanBahamas, TheBahrainBangladeshBarbadosBelarusBelizeBeninBhutanBoliviaBosnia and HerzegovinaBotswanaBrazilBrunei DarussalamBulgariaBurkina FasoBurundiCabo VerdeCambodiaCameroonCanadaCaribbean small statesCentral African RepublicCentral Europe and the BalticsChadChileChinaColombiaComorosCongo, Dem. Rep.Congo, Rep.Costa RicaCote d'IvoireCroatiaCzech RepublicDenmarkDjiboutiDominicaDominican RepublicEarly-demographic dividendEast Asia & PacificEast Asia & Pacific (excluding high income)East Asia & Pacific (IDA & IBRD countries)EcuadorEgypt, Arab Rep.El SalvadorEquatorial GuineaEritreaEstoniaEthiopiaEurope & Central Asia (excluding high income)Europe & Central Asia (IDA & IBRD countries)FijiFragile and conflict affected situationsGabonGambia, TheGeorgiaGhanaGrenadaGuatemalaGuineaGuinea-BissauGuyanaHaitiHeavily indebted poor countries (HIPC)High incomeHondurasHong Kong SAR, ChinaHungaryIBRD onlyIcelandIDA & IBRD totalIDA blendIDA onlyIDA totalIndiaIndonesiaIran, Islamic Rep.IraqIsraelJamaicaJapanJordanKazakhstanKenyaKorea, Rep.KuwaitKyrgyz RepublicLao PDRLate-demographic dividendLatin America & Caribbean Latin America & Caribbean (excluding high income)Latin America & the Caribbean (IDA & IBRD countries)LatviaLeast developed countries: UN classificationLebanonLesothoLiberiaLibyaLithuaniaLow & middle incomeLow incomeLower middle incomeMacao SAR, ChinaMacedonia, FYRMadagascarMalawiMalaysiaMaldivesMaliMauritaniaMauritiusMexicoMicronesia, Fed. Sts.Middle East & North AfricaMiddle East & North Africa (excluding high income)Middle East & North Africa (IDA & IBRD countries)Middle incomeMoldovaMongoliaMoroccoMozambiqueMyanmarNamibiaNepalNew ZealandNicaraguaNigerNigeriaNorth AmericaNorwayOECD membersOmanOther small statesPacific island small statesPakistanPanamaPapua New GuineaParaguayPeruPhilippinesPolandPost-demographic dividendPre-demographic dividendQatarRomaniaRussian FederationRwandaSamoaSao Tome and PrincipeSaudi ArabiaSenegalSerbiaSeychellesSierra LeoneSingaporeSlovak RepublicSmall statesSolomon IslandsSouth AfricaSouth AsiaSouth Asia (IDA & IBRD)South SudanSri LankaSt. Kitts and NevisSt. LuciaSt. Vincent and the GrenadinesSub-Saharan Africa Sub-Saharan Africa (excluding high income)Sub-Saharan Africa (IDA & IBRD countries)SudanSurinameSwazilandSwedenSwitzerlandSyrian Arab RepublicTajikistanTanzaniaThailandTimor-LesteTogoTongaTrinidad and TobagoTunisiaTurkeyUgandaUkraineUnited Arab EmiratesUnited KingdomUnited StatesUpper middle incomeUruguayVanuatuVenezuela, RBVietnamWest Bank and GazaWorldYemen, Rep.ZambiaZimbabwe Timeline:
This timeline shows a graph from 1961 to 2016 of Early-demographic dividend. No data until 1960. Number of actual observations by date: 56.
Source name:
World Development Indicators
Source organization:
International Monetary Fund, International Financial Statistics and data files, and World Bank and OECD GDP estimates.
Categories, topics:
Financial Sector
Last updated:
apr 23, 2017
Indicators value changes by year
Minimum:
20.584
jan 1, 1961
Maximum:
63.293
jan 1, 2015
At the date of observation
Value
Absolute change
Change from previous value
jan 1, 1961
20.584
+20.584
0.0%
jan 1, 1962
20.995
+0.411
2.0%
jan 1, 1963
21.405
+0.41
1.95%
jan 1, 1964
21.579
+0.174
0.81%
jan 1, 1965
21.777
+0.197
0.91%
jan 1, 1966
25.386
+3.609
16.57%
jan 1, 1967
26.113
+0.727
2.87%
jan 1, 1968
26.401
+0.288
1.1%
jan 1, 1969
27.199
+0.798
3.02%
jan 1, 1970
27.232
+0.033
0.12%
jan 1, 1971
28.291
+1.059
3.89%
jan 1, 1972
28.497
+0.206
0.73%
jan 1, 1973
29.514
+1.017
3.57%
jan 1, 1974
28.993
-0.522
-1.77%
jan 1, 1975
25.845
-3.148
-10.86%
jan 1, 1976
27.362
+1.517
5.87%
jan 1, 1977
29.221
+1.859
6.79%
jan 1, 1978
29.658
+0.437
1.5%
jan 1, 1979
32.029
+2.372
8.0%
jan 1, 1980
32.137
+0.107
0.33%
jan 1, 1981
31.847
-0.29
-0.9%
jan 1, 1982
33.804
+1.958
6.15%
jan 1, 1983
36.07
+2.265
6.7%
jan 1, 1984
38.595
+2.526
7.0%
jan 1, 1985
39.133
+0.538
1.39%
jan 1, 1986
38.384
-0.749
-1.91%
jan 1, 1987
43.385
+5.001
13.03%
jan 1, 1988
42.908
-0.477
-1.1%
jan 1, 1989
40.83
-2.078
-4.84%
jan 1, 1990
40.243
-0.586
-1.44%
jan 1, 1991
38.024
-2.22
-5.52%
jan 1, 1992
36.11
-1.914
-5.03%
jan 1, 1993
36.615
+0.506
1.4%
jan 1, 1994
35.828
-0.787
-2.15%
jan 1, 1995
37.634
+1.806
5.04%
jan 1, 1996
38.639
+1.005
2.67%
jan 1, 1997
39.47
+0.831
2.15%
jan 1, 1998
41.615
+2.145
5.44%
jan 1, 1999
41.248
-0.367
-0.88%
jan 1, 2000
42.991
+1.743
4.23%
jan 1, 2001
40.98
-2.011
-4.68%
jan 1, 2002
45.961
+4.981
12.16%
jan 1, 2003
48.638
+2.677
5.82%
jan 1, 2004
49.031
+0.393
0.81%
jan 1, 2005
47.974
-1.057
-2.16%
jan 1, 2006
48.541
+0.567
1.18%
jan 1, 2007
50.645
+2.103
4.33%
jan 1, 2008
54.526
+3.882
7.66%
jan 1, 2009
54.571
+0.045
0.08%
jan 1, 2010
59.877
+5.305
9.72%
jan 1, 2011
58.051
-1.826
-3.05%
jan 1, 2012
57.532
-0.519
-0.89%
jan 1, 2013
57.949
+0.417
0.73%
jan 1, 2014
60.677
+2.728
4.71%
jan 1, 2015
63.293
+2.616
4.31%
jan 1, 2016
62.845
-0.448
-0.71%
Ranking of countries by current statistics by years


Comments: