29
/
en
AIzaSyAYiBZKx7MnpbEhh9jyipgxe19OcubqV5w
April 1, 2024
251667
St. Vincent and the Grenadines
VCT
true
2
1
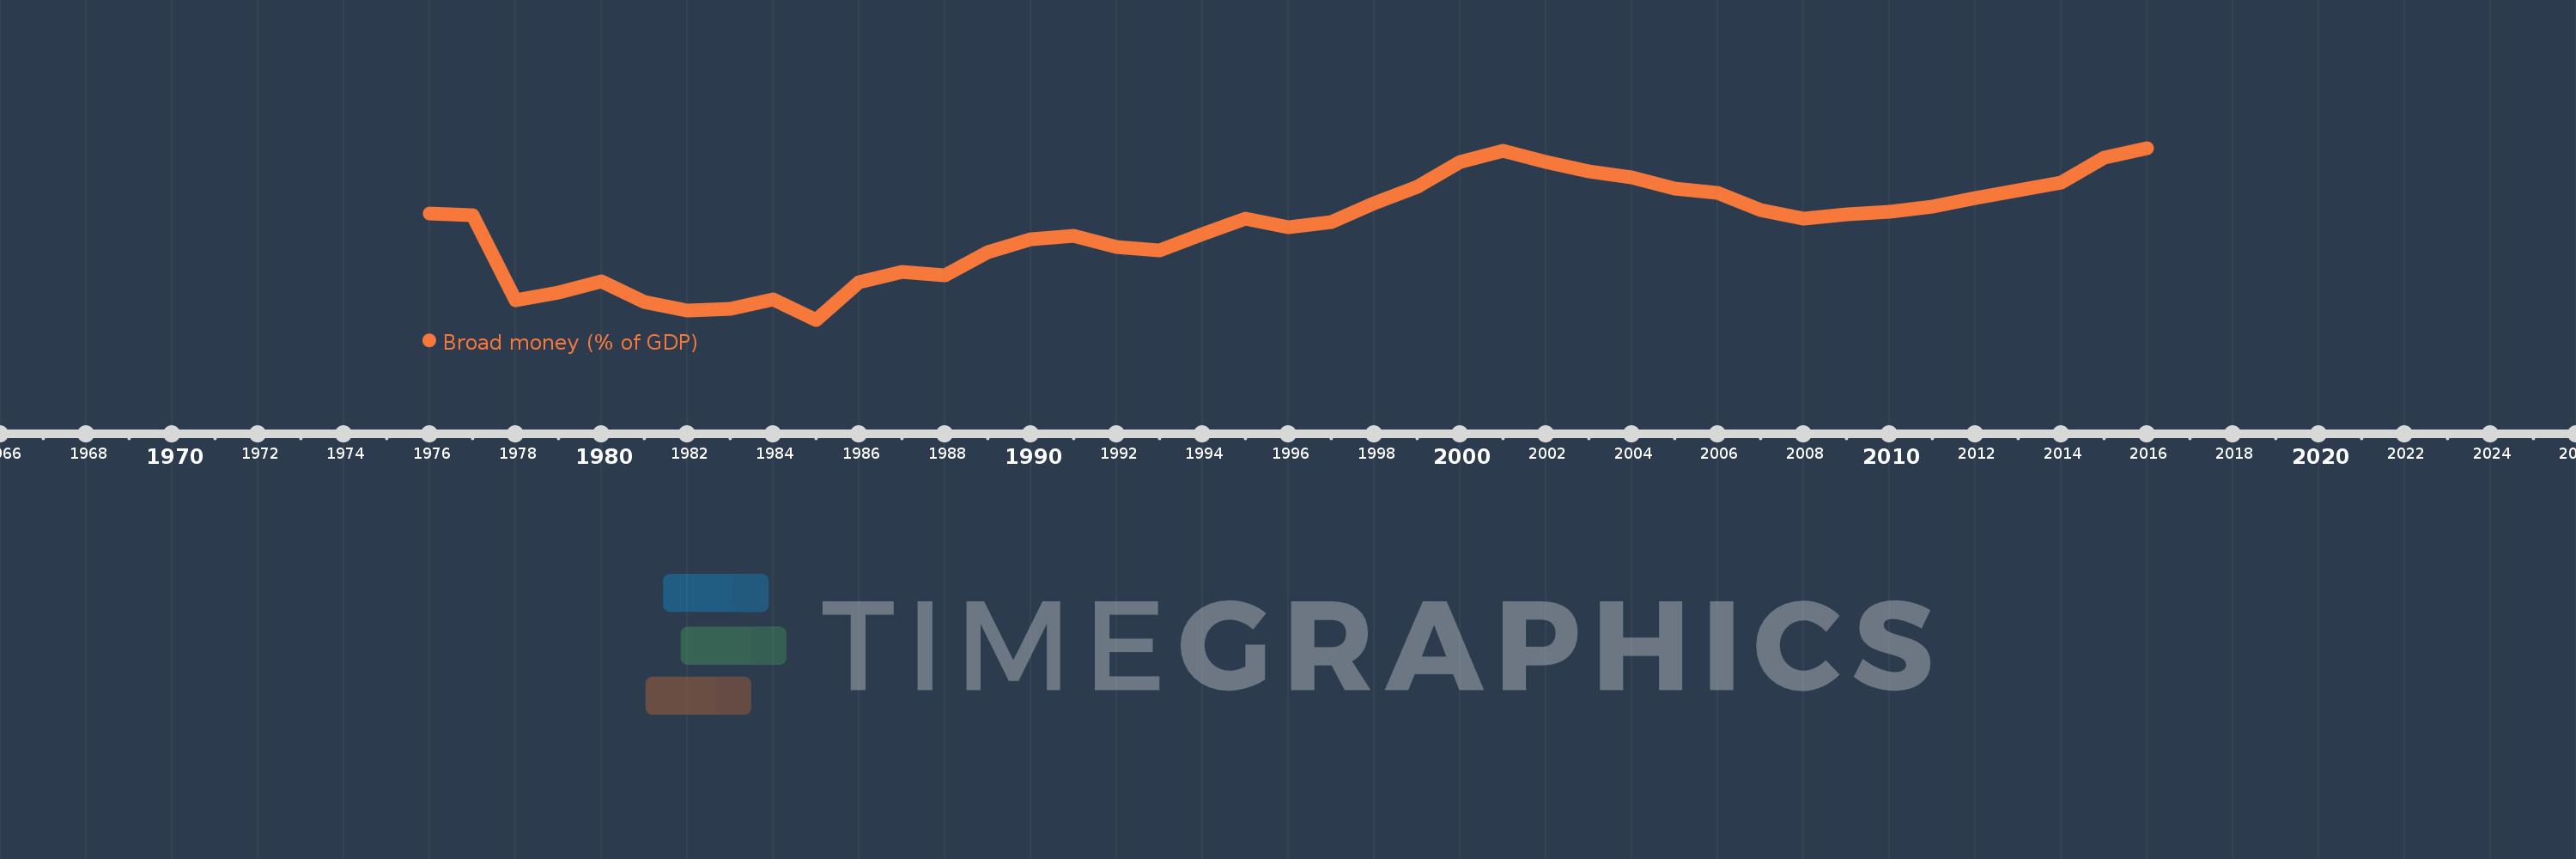
Broad money (% of GDP)
2016,2015,2014,2013,2012,2011,2010,2009,2008,2007,2006,2005,2004,2003,2002,2001,2000,1999,1998,1997,1996,1995,1994,1993,1992,1991,1990,1989,1988,1987,1986,1985,1984,1983,1982,1981,1980,1979,1978,1977,1976
This statistics in other country:
AfghanistanAlbaniaAlgeriaAngolaAntigua and BarbudaArab WorldArgentinaArmeniaArubaAustraliaAzerbaijanBahamas, TheBahrainBangladeshBarbadosBelarusBelizeBeninBhutanBoliviaBosnia and HerzegovinaBotswanaBrazilBrunei DarussalamBulgariaBurkina FasoBurundiCabo VerdeCambodiaCameroonCanadaCaribbean small statesCentral African RepublicCentral Europe and the BalticsChadChileChinaColombiaComorosCongo, Dem. Rep.Congo, Rep.Costa RicaCote d'IvoireCroatiaCzech RepublicDenmarkDjiboutiDominicaDominican RepublicEarly-demographic dividendEast Asia & PacificEast Asia & Pacific (excluding high income)East Asia & Pacific (IDA & IBRD countries)EcuadorEgypt, Arab Rep.El SalvadorEquatorial GuineaEritreaEstoniaEthiopiaEurope & Central Asia (excluding high income)Europe & Central Asia (IDA & IBRD countries)FijiFragile and conflict affected situationsGabonGambia, TheGeorgiaGhanaGrenadaGuatemalaGuineaGuinea-BissauGuyanaHaitiHeavily indebted poor countries (HIPC)High incomeHondurasHong Kong SAR, ChinaHungaryIBRD onlyIcelandIDA & IBRD totalIDA blendIDA onlyIDA totalIndiaIndonesiaIran, Islamic Rep.IraqIsraelJamaicaJapanJordanKazakhstanKenyaKorea, Rep.KuwaitKyrgyz RepublicLao PDRLate-demographic dividendLatin America & Caribbean Latin America & Caribbean (excluding high income)Latin America & the Caribbean (IDA & IBRD countries)LatviaLeast developed countries: UN classificationLebanonLesothoLiberiaLibyaLithuaniaLow & middle incomeLow incomeLower middle incomeMacao SAR, ChinaMacedonia, FYRMadagascarMalawiMalaysiaMaldivesMaliMauritaniaMauritiusMexicoMicronesia, Fed. Sts.Middle East & North AfricaMiddle East & North Africa (excluding high income)Middle East & North Africa (IDA & IBRD countries)Middle incomeMoldovaMongoliaMoroccoMozambiqueMyanmarNamibiaNepalNew ZealandNicaraguaNigerNigeriaNorth AmericaNorwayOECD membersOmanOther small statesPacific island small statesPakistanPanamaPapua New GuineaParaguayPeruPhilippinesPolandPost-demographic dividendPre-demographic dividendQatarRomaniaRussian FederationRwandaSamoaSao Tome and PrincipeSaudi ArabiaSenegalSerbiaSeychellesSierra LeoneSingaporeSlovak RepublicSmall statesSolomon IslandsSouth AfricaSouth AsiaSouth Asia (IDA & IBRD)South SudanSri LankaSt. Kitts and NevisSt. LuciaSt. Vincent and the GrenadinesSub-Saharan Africa Sub-Saharan Africa (excluding high income)Sub-Saharan Africa (IDA & IBRD countries)SudanSurinameSwazilandSwedenSwitzerlandSyrian Arab RepublicTajikistanTanzaniaThailandTimor-LesteTogoTongaTrinidad and TobagoTunisiaTurkeyUgandaUkraineUnited Arab EmiratesUnited KingdomUnited StatesUpper middle incomeUruguayVanuatuVenezuela, RBVietnamWest Bank and GazaWorldYemen, Rep.ZambiaZimbabwe Timeline:
This timeline shows a graph from 1976 to 2016 of St. Vincent and the Grenadines. No data until 1975. Number of actual observations by date: 41.
Source name:
World Development Indicators
Source organization:
International Monetary Fund, International Financial Statistics and data files, and World Bank and OECD GDP estimates.
Categories, topics:
Financial Sector
Last updated:
apr 23, 2017
Indicators value changes by year
Minimum:
41.541
jan 1, 1985
At the date of observation
Value
Absolute change
Change from previous value
jan 1, 1976
65.325
+65.325
0.0%
jan 1, 1977
65.07
-0.254
-0.39%
jan 1, 1978
46.012
-19.059
-29.29%
jan 1, 1979
47.601
+1.59
3.46%
jan 1, 1980
50.233
+2.631
5.53%
jan 1, 1981
45.473
-4.76
-9.48%
jan 1, 1982
43.528
-1.945
-4.28%
jan 1, 1983
43.965
+0.437
1.0%
jan 1, 1984
46.064
+2.099
4.77%
jan 1, 1985
41.541
-4.523
-9.82%
jan 1, 1986
49.902
+8.361
20.13%
jan 1, 1987
52.299
+2.397
4.8%
jan 1, 1988
51.45
-0.849
-1.62%
jan 1, 1989
56.68
+5.23
10.16%
jan 1, 1990
59.634
+2.954
5.21%
jan 1, 1991
60.45
+0.815
1.37%
jan 1, 1992
57.854
-2.595
-4.29%
jan 1, 1993
57.187
-0.667
-1.15%
jan 1, 1994
60.82
+3.633
6.35%
jan 1, 1995
64.232
+3.413
5.61%
jan 1, 1996
62.256
-1.976
-3.08%
jan 1, 1997
63.382
+1.127
1.81%
jan 1, 1998
67.704
+4.322
6.82%
jan 1, 1999
71.3
+3.595
5.31%
jan 1, 2000
76.966
+5.666
7.95%
jan 1, 2001
79.498
+2.532
3.29%
jan 1, 2002
76.935
-2.563
-3.22%
jan 1, 2003
74.892
-2.043
-2.65%
jan 1, 2004
73.415
-1.477
-1.97%
jan 1, 2005
70.969
-2.446
-3.33%
jan 1, 2006
69.95
-1.019
-1.44%
jan 1, 2007
66.076
-3.874
-5.54%
jan 1, 2008
64.242
-1.834
-2.78%
jan 1, 2009
65.213
+0.971
1.51%
jan 1, 2010
65.842
+0.629
0.96%
jan 1, 2011
66.979
+1.136
1.73%
jan 1, 2012
68.942
+1.963
2.93%
jan 1, 2013
70.561
+1.618
2.35%
jan 1, 2014
72.368
+1.807
2.56%
jan 1, 2015
77.939
+5.571
7.7%
jan 1, 2016
80.11
+2.171
2.79%
Ranking of countries by current statistics by years


Comments: