29
/
en
AIzaSyAYiBZKx7MnpbEhh9jyipgxe19OcubqV5w
April 1, 2024
256094
Sweden
SWE
true
2
1
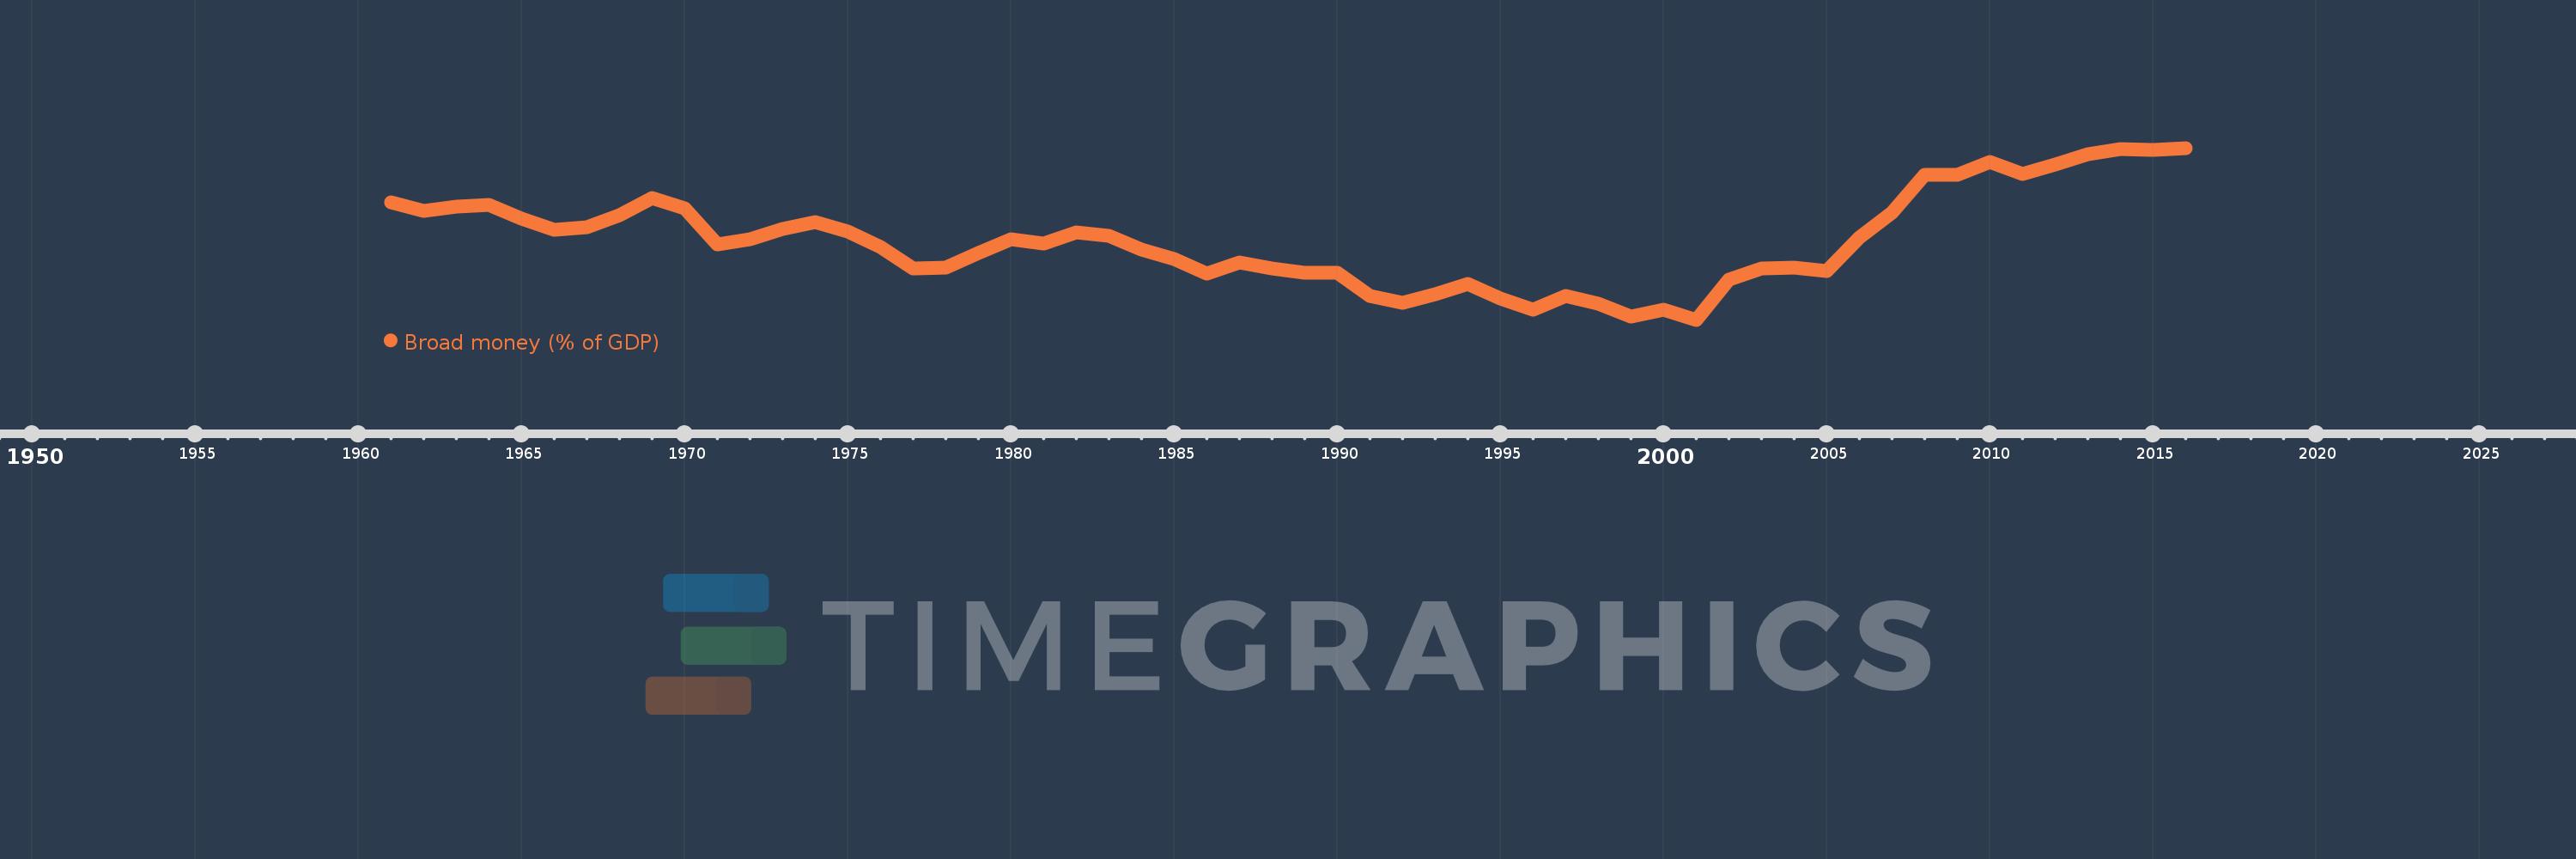
Broad money (% of GDP)
2016,2015,2014,2013,2012,2011,2010,2009,2008,2007,2006,2005,2004,2003,2002,2001,2000,1999,1998,1997,1996,1995,1994,1993,1992,1991,1990,1989,1988,1987,1986,1985,1984,1983,1982,1981,1980,1979,1978,1977,1976,1975,1974,1973,1972,1971,1970,1969,1968,1967,1966,1965,1964,1963,1962,1961
This statistics in other country:
AfghanistanAlbaniaAlgeriaAngolaAntigua and BarbudaArab WorldArgentinaArmeniaArubaAustraliaAzerbaijanBahamas, TheBahrainBangladeshBarbadosBelarusBelizeBeninBhutanBoliviaBosnia and HerzegovinaBotswanaBrazilBrunei DarussalamBulgariaBurkina FasoBurundiCabo VerdeCambodiaCameroonCanadaCaribbean small statesCentral African RepublicCentral Europe and the BalticsChadChileChinaColombiaComorosCongo, Dem. Rep.Congo, Rep.Costa RicaCote d'IvoireCroatiaCzech RepublicDenmarkDjiboutiDominicaDominican RepublicEarly-demographic dividendEast Asia & PacificEast Asia & Pacific (excluding high income)East Asia & Pacific (IDA & IBRD countries)EcuadorEgypt, Arab Rep.El SalvadorEquatorial GuineaEritreaEstoniaEthiopiaEurope & Central Asia (excluding high income)Europe & Central Asia (IDA & IBRD countries)FijiFragile and conflict affected situationsGabonGambia, TheGeorgiaGhanaGrenadaGuatemalaGuineaGuinea-BissauGuyanaHaitiHeavily indebted poor countries (HIPC)High incomeHondurasHong Kong SAR, ChinaHungaryIBRD onlyIcelandIDA & IBRD totalIDA blendIDA onlyIDA totalIndiaIndonesiaIran, Islamic Rep.IraqIsraelJamaicaJapanJordanKazakhstanKenyaKorea, Rep.KuwaitKyrgyz RepublicLao PDRLate-demographic dividendLatin America & Caribbean Latin America & Caribbean (excluding high income)Latin America & the Caribbean (IDA & IBRD countries)LatviaLeast developed countries: UN classificationLebanonLesothoLiberiaLibyaLithuaniaLow & middle incomeLow incomeLower middle incomeMacao SAR, ChinaMacedonia, FYRMadagascarMalawiMalaysiaMaldivesMaliMauritaniaMauritiusMexicoMicronesia, Fed. Sts.Middle East & North AfricaMiddle East & North Africa (excluding high income)Middle East & North Africa (IDA & IBRD countries)Middle incomeMoldovaMongoliaMoroccoMozambiqueMyanmarNamibiaNepalNew ZealandNicaraguaNigerNigeriaNorth AmericaNorwayOECD membersOmanOther small statesPacific island small statesPakistanPanamaPapua New GuineaParaguayPeruPhilippinesPolandPost-demographic dividendPre-demographic dividendQatarRomaniaRussian FederationRwandaSamoaSao Tome and PrincipeSaudi ArabiaSenegalSerbiaSeychellesSierra LeoneSingaporeSlovak RepublicSmall statesSolomon IslandsSouth AfricaSouth AsiaSouth Asia (IDA & IBRD)South SudanSri LankaSt. Kitts and NevisSt. LuciaSt. Vincent and the GrenadinesSub-Saharan Africa Sub-Saharan Africa (excluding high income)Sub-Saharan Africa (IDA & IBRD countries)SudanSurinameSwazilandSwedenSwitzerlandSyrian Arab RepublicTajikistanTanzaniaThailandTimor-LesteTogoTongaTrinidad and TobagoTunisiaTurkeyUgandaUkraineUnited Arab EmiratesUnited KingdomUnited StatesUpper middle incomeUruguayVanuatuVenezuela, RBVietnamWest Bank and GazaWorldYemen, Rep.ZambiaZimbabwe Timeline:
This timeline shows a graph from 1961 to 2016 of Sweden. No data until 1960. Number of actual observations by date: 56.
Source name:
World Development Indicators
Source organization:
International Monetary Fund, International Financial Statistics and data files, and World Bank and OECD GDP estimates.
Categories, topics:
Financial Sector
Last updated:
apr 23, 2017
Indicators value changes by year
Minimum:
38.223
jan 1, 2001
Maximum:
67.209
jan 1, 2016
At the date of observation
Value
Absolute change
Change from previous value
jan 1, 1961
58.029
+58.029
0.0%
jan 1, 1962
56.628
-1.401
-2.41%
jan 1, 1963
57.276
+0.648
1.14%
jan 1, 1964
57.552
+0.276
0.48%
jan 1, 1965
55.333
-2.219
-3.86%
jan 1, 1966
53.421
-1.912
-3.45%
jan 1, 1967
53.775
+0.353
0.66%
jan 1, 1968
55.858
+2.083
3.87%
jan 1, 1969
58.743
+2.886
5.17%
jan 1, 1970
57.013
-1.73
-2.94%
jan 1, 1971
50.893
-6.12
-10.73%
jan 1, 1972
51.861
+0.968
1.9%
jan 1, 1973
53.522
+1.661
3.2%
jan 1, 1974
54.709
+1.187
2.22%
jan 1, 1975
53.127
-1.582
-2.89%
jan 1, 1976
50.511
-2.616
-4.92%
jan 1, 1977
46.913
-3.598
-7.12%
jan 1, 1978
47.052
+0.139
0.3%
jan 1, 1979
49.55
+2.498
5.31%
jan 1, 1980
51.773
+2.223
4.49%
jan 1, 1981
51.13
-0.643
-1.24%
jan 1, 1982
53.018
+1.888
3.69%
jan 1, 1983
52.332
-0.685
-1.29%
jan 1, 1984
50.076
-2.256
-4.31%
jan 1, 1985
48.423
-1.654
-3.3%
jan 1, 1986
46.012
-2.41
-4.98%
jan 1, 1987
47.891
+1.879
4.08%
jan 1, 1988
46.887
-1.004
-2.1%
jan 1, 1989
46.151
-0.736
-1.57%
jan 1, 1990
46.223
+0.071
0.15%
jan 1, 1991
42.231
-3.992
-8.64%
jan 1, 1992
41.105
-1.126
-2.67%
jan 1, 1993
42.518
+1.413
3.44%
jan 1, 1994
44.245
+1.727
4.06%
jan 1, 1995
41.736
-2.51
-5.67%
jan 1, 1996
39.848
-1.888
-4.52%
jan 1, 1997
42.291
+2.444
6.13%
jan 1, 1998
40.919
-1.373
-3.25%
jan 1, 1999
38.785
-2.134
-5.21%
jan 1, 2000
39.89
+1.105
2.85%
jan 1, 2001
38.223
-1.668
-4.18%
jan 1, 2002
44.949
+6.727
17.6%
jan 1, 2003
46.924
+1.974
4.39%
jan 1, 2004
47.025
+0.102
0.22%
jan 1, 2005
46.398
-0.628
-1.33%
jan 1, 2006
52.144
+5.747
12.39%
jan 1, 2007
56.267
+4.122
7.91%
jan 1, 2008
62.72
+6.453
11.47%
jan 1, 2009
62.703
-0.017
-0.03%
jan 1, 2010
64.919
+2.216
3.53%
jan 1, 2011
62.774
-2.145
-3.3%
jan 1, 2012
64.447
+1.673
2.67%
jan 1, 2013
66.108
+1.661
2.58%
jan 1, 2014
67.082
+0.973
1.47%
jan 1, 2015
66.921
-0.161
-0.24%
jan 1, 2016
67.209
+0.288
0.43%
Ranking of countries by current statistics by years


Comments: