29
/
en
AIzaSyAYiBZKx7MnpbEhh9jyipgxe19OcubqV5w
April 1, 2024
188756
Maldives
MDV
true
2
1
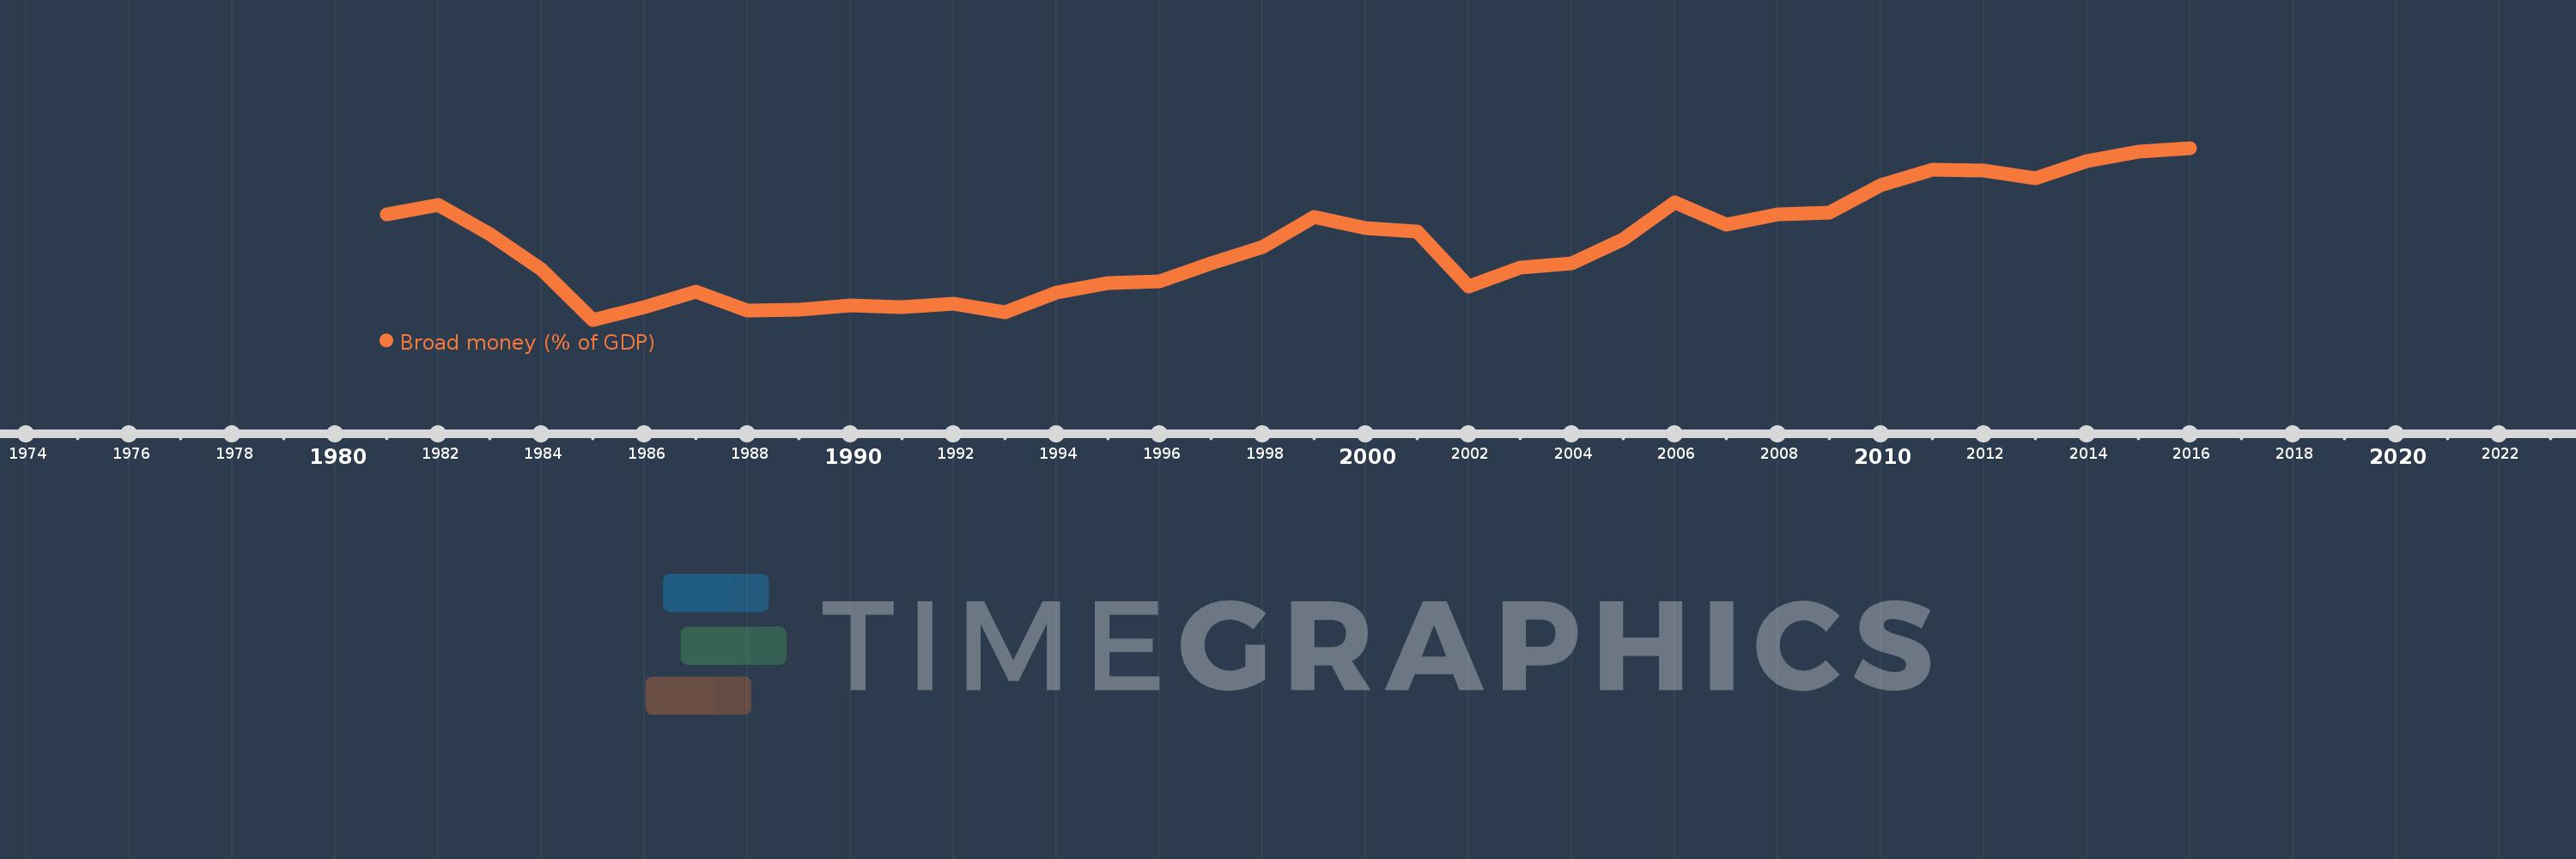
Broad money (% of GDP)
2016,2015,2014,2013,2012,2011,2010,2009,2008,2007,2006,2005,2004,2003,2002,2001,2000,1999,1998,1997,1996,1995,1994,1993,1992,1991,1990,1989,1988,1987,1986,1985,1984,1983,1982,1981
This statistics in other country:
AfghanistanAlbaniaAlgeriaAngolaAntigua and BarbudaArab WorldArgentinaArmeniaArubaAustraliaAzerbaijanBahamas, TheBahrainBangladeshBarbadosBelarusBelizeBeninBhutanBoliviaBosnia and HerzegovinaBotswanaBrazilBrunei DarussalamBulgariaBurkina FasoBurundiCabo VerdeCambodiaCameroonCanadaCaribbean small statesCentral African RepublicCentral Europe and the BalticsChadChileChinaColombiaComorosCongo, Dem. Rep.Congo, Rep.Costa RicaCote d'IvoireCroatiaCzech RepublicDenmarkDjiboutiDominicaDominican RepublicEarly-demographic dividendEast Asia & PacificEast Asia & Pacific (excluding high income)East Asia & Pacific (IDA & IBRD countries)EcuadorEgypt, Arab Rep.El SalvadorEquatorial GuineaEritreaEstoniaEthiopiaEurope & Central Asia (excluding high income)Europe & Central Asia (IDA & IBRD countries)FijiFragile and conflict affected situationsGabonGambia, TheGeorgiaGhanaGrenadaGuatemalaGuineaGuinea-BissauGuyanaHaitiHeavily indebted poor countries (HIPC)High incomeHondurasHong Kong SAR, ChinaHungaryIBRD onlyIcelandIDA & IBRD totalIDA blendIDA onlyIDA totalIndiaIndonesiaIran, Islamic Rep.IraqIsraelJamaicaJapanJordanKazakhstanKenyaKorea, Rep.KuwaitKyrgyz RepublicLao PDRLate-demographic dividendLatin America & Caribbean Latin America & Caribbean (excluding high income)Latin America & the Caribbean (IDA & IBRD countries)LatviaLeast developed countries: UN classificationLebanonLesothoLiberiaLibyaLithuaniaLow & middle incomeLow incomeLower middle incomeMacao SAR, ChinaMacedonia, FYRMadagascarMalawiMalaysiaMaldivesMaliMauritaniaMauritiusMexicoMicronesia, Fed. Sts.Middle East & North AfricaMiddle East & North Africa (excluding high income)Middle East & North Africa (IDA & IBRD countries)Middle incomeMoldovaMongoliaMoroccoMozambiqueMyanmarNamibiaNepalNew ZealandNicaraguaNigerNigeriaNorth AmericaNorwayOECD membersOmanOther small statesPacific island small statesPakistanPanamaPapua New GuineaParaguayPeruPhilippinesPolandPost-demographic dividendPre-demographic dividendQatarRomaniaRussian FederationRwandaSamoaSao Tome and PrincipeSaudi ArabiaSenegalSerbiaSeychellesSierra LeoneSingaporeSlovak RepublicSmall statesSolomon IslandsSouth AfricaSouth AsiaSouth Asia (IDA & IBRD)South SudanSri LankaSt. Kitts and NevisSt. LuciaSt. Vincent and the GrenadinesSub-Saharan Africa Sub-Saharan Africa (excluding high income)Sub-Saharan Africa (IDA & IBRD countries)SudanSurinameSwazilandSwedenSwitzerlandSyrian Arab RepublicTajikistanTanzaniaThailandTimor-LesteTogoTongaTrinidad and TobagoTunisiaTurkeyUgandaUkraineUnited Arab EmiratesUnited KingdomUnited StatesUpper middle incomeUruguayVanuatuVenezuela, RBVietnamWest Bank and GazaWorldYemen, Rep.ZambiaZimbabwe Timeline:
This timeline shows a graph from 1981 to 2016 of Maldives. No data until 1980. Number of actual observations by date: 36.
Source name:
World Development Indicators
Source organization:
International Monetary Fund, International Financial Statistics and data files, and World Bank and OECD GDP estimates.
Categories, topics:
Financial Sector
Last updated:
apr 23, 2017
Indicators value changes by year
Minimum:
23.513
jan 1, 1985
Maximum:
57.764
jan 1, 2016
At the date of observation
Value
Absolute change
Change from previous value
jan 1, 1981
44.576
+44.576
0.0%
jan 1, 1982
46.381
+1.804
4.05%
jan 1, 1983
40.565
-5.816
-12.54%
jan 1, 1984
33.635
-6.93
-17.08%
jan 1, 1985
23.513
-10.122
-30.09%
jan 1, 1986
26.042
+2.529
10.76%
jan 1, 1987
29.05
+3.007
11.55%
jan 1, 1988
25.321
-3.729
-12.83%
jan 1, 1989
25.455
+0.134
0.53%
jan 1, 1990
26.372
+0.917
3.6%
jan 1, 1991
26.088
-0.284
-1.08%
jan 1, 1992
26.68
+0.592
2.27%
jan 1, 1993
24.993
-1.687
-6.32%
jan 1, 1994
28.949
+3.956
15.83%
jan 1, 1995
30.743
+1.794
6.2%
jan 1, 1996
31.163
+0.42
1.36%
jan 1, 1997
34.822
+3.659
11.74%
jan 1, 1998
38.054
+3.233
9.28%
jan 1, 1999
44.044
+5.99
15.74%
jan 1, 2000
41.795
-2.249
-5.11%
jan 1, 2001
41.091
-0.704
-1.68%
jan 1, 2002
30.067
-11.024
-26.83%
jan 1, 2003
33.937
+3.87
12.87%
jan 1, 2004
34.716
+0.779
2.29%
jan 1, 2005
39.58
+4.864
14.01%
jan 1, 2006
47.003
+7.423
18.76%
jan 1, 2007
42.427
-4.576
-9.74%
jan 1, 2008
44.471
+2.044
4.82%
jan 1, 2009
44.84
+0.369
0.83%
jan 1, 2010
50.364
+5.523
12.32%
jan 1, 2011
53.41
+3.047
6.05%
jan 1, 2012
53.293
-0.117
-0.22%
jan 1, 2013
51.693
-1.6
-3.0%
jan 1, 2014
55.123
+3.431
6.64%
jan 1, 2015
57.073
+1.95
3.54%
jan 1, 2016
57.764
+0.691
1.21%
Ranking of countries by current statistics by years


Comments: