29
/
en
AIzaSyAYiBZKx7MnpbEhh9jyipgxe19OcubqV5w
April 1, 2024
267692
Tunisia
TUN
true
2
1
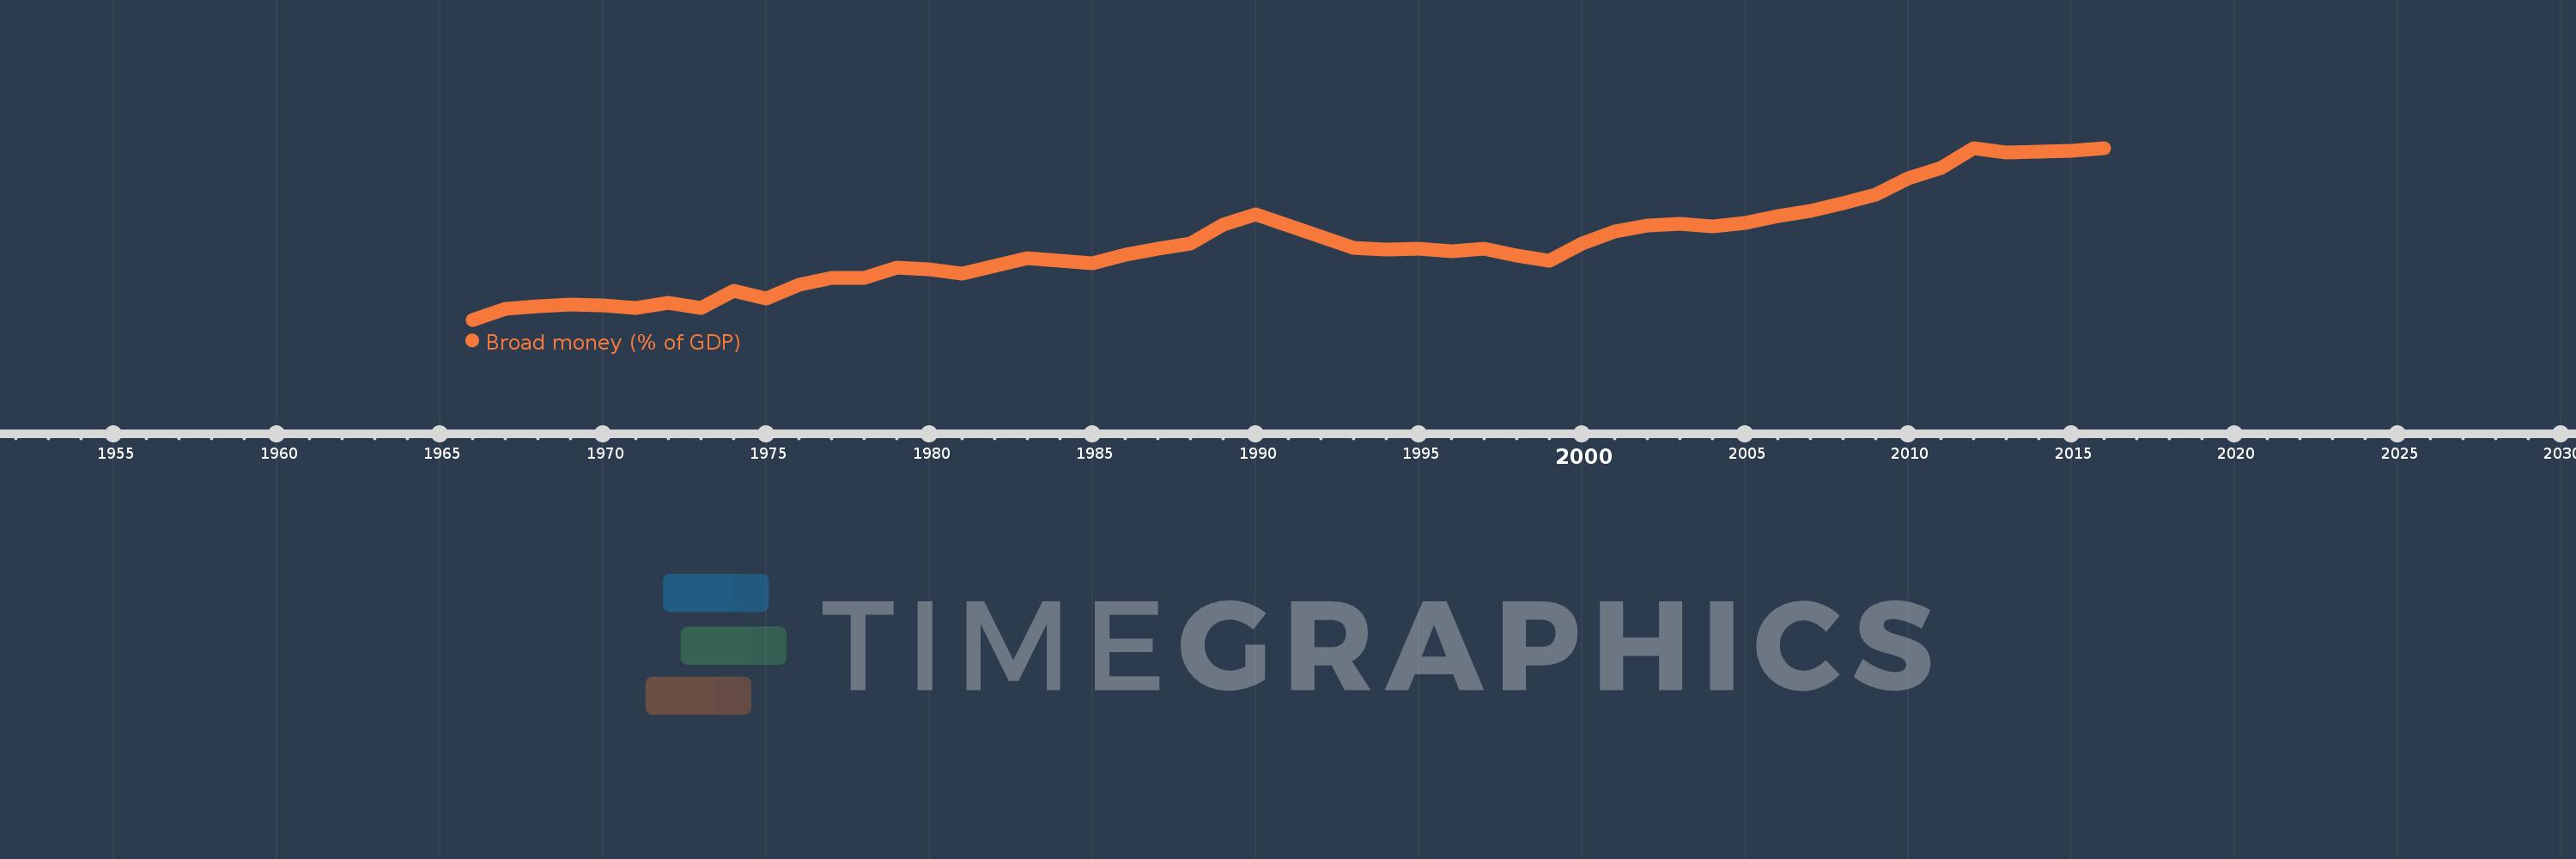
Broad money (% of GDP)
2016,2015,2014,2013,2012,2011,2010,2009,2008,2007,2006,2005,2004,2003,2002,2001,2000,1999,1998,1997,1996,1995,1994,1993,1992,1991,1990,1989,1988,1987,1986,1985,1984,1983,1982,1981,1980,1979,1978,1977,1976,1975,1974,1973,1972,1971,1970,1969,1968,1967,1966
This statistics in other country:
AfghanistanAlbaniaAlgeriaAngolaAntigua and BarbudaArab WorldArgentinaArmeniaArubaAustraliaAzerbaijanBahamas, TheBahrainBangladeshBarbadosBelarusBelizeBeninBhutanBoliviaBosnia and HerzegovinaBotswanaBrazilBrunei DarussalamBulgariaBurkina FasoBurundiCabo VerdeCambodiaCameroonCanadaCaribbean small statesCentral African RepublicCentral Europe and the BalticsChadChileChinaColombiaComorosCongo, Dem. Rep.Congo, Rep.Costa RicaCote d'IvoireCroatiaCzech RepublicDenmarkDjiboutiDominicaDominican RepublicEarly-demographic dividendEast Asia & PacificEast Asia & Pacific (excluding high income)East Asia & Pacific (IDA & IBRD countries)EcuadorEgypt, Arab Rep.El SalvadorEquatorial GuineaEritreaEstoniaEthiopiaEurope & Central Asia (excluding high income)Europe & Central Asia (IDA & IBRD countries)FijiFragile and conflict affected situationsGabonGambia, TheGeorgiaGhanaGrenadaGuatemalaGuineaGuinea-BissauGuyanaHaitiHeavily indebted poor countries (HIPC)High incomeHondurasHong Kong SAR, ChinaHungaryIBRD onlyIcelandIDA & IBRD totalIDA blendIDA onlyIDA totalIndiaIndonesiaIran, Islamic Rep.IraqIsraelJamaicaJapanJordanKazakhstanKenyaKorea, Rep.KuwaitKyrgyz RepublicLao PDRLate-demographic dividendLatin America & Caribbean Latin America & Caribbean (excluding high income)Latin America & the Caribbean (IDA & IBRD countries)LatviaLeast developed countries: UN classificationLebanonLesothoLiberiaLibyaLithuaniaLow & middle incomeLow incomeLower middle incomeMacao SAR, ChinaMacedonia, FYRMadagascarMalawiMalaysiaMaldivesMaliMauritaniaMauritiusMexicoMicronesia, Fed. Sts.Middle East & North AfricaMiddle East & North Africa (excluding high income)Middle East & North Africa (IDA & IBRD countries)Middle incomeMoldovaMongoliaMoroccoMozambiqueMyanmarNamibiaNepalNew ZealandNicaraguaNigerNigeriaNorth AmericaNorwayOECD membersOmanOther small statesPacific island small statesPakistanPanamaPapua New GuineaParaguayPeruPhilippinesPolandPost-demographic dividendPre-demographic dividendQatarRomaniaRussian FederationRwandaSamoaSao Tome and PrincipeSaudi ArabiaSenegalSerbiaSeychellesSierra LeoneSingaporeSlovak RepublicSmall statesSolomon IslandsSouth AfricaSouth AsiaSouth Asia (IDA & IBRD)South SudanSri LankaSt. Kitts and NevisSt. LuciaSt. Vincent and the GrenadinesSub-Saharan Africa Sub-Saharan Africa (excluding high income)Sub-Saharan Africa (IDA & IBRD countries)SudanSurinameSwazilandSwedenSwitzerlandSyrian Arab RepublicTajikistanTanzaniaThailandTimor-LesteTogoTongaTrinidad and TobagoTunisiaTurkeyUgandaUkraineUnited Arab EmiratesUnited KingdomUnited StatesUpper middle incomeUruguayVanuatuVenezuela, RBVietnamWest Bank and GazaWorldYemen, Rep.ZambiaZimbabwe Timeline:
This timeline shows a graph from 1966 to 2016 of Tunisia. No data until 1965. Number of actual observations by date: 51.
Source name:
World Development Indicators
Source organization:
International Monetary Fund, International Financial Statistics and data files, and World Bank and OECD GDP estimates.
Categories, topics:
Financial Sector
Last updated:
apr 23, 2017
Indicators value changes by year
Maximum:
68.587
jan 1, 2016
At the date of observation
Value
Absolute change
Change from previous value
jan 1, 1966
30.68
+30.68
0.0%
jan 1, 1967
33.03
+2.35
7.66%
jan 1, 1968
33.686
+0.656
1.99%
jan 1, 1969
33.993
+0.307
0.91%
jan 1, 1970
33.94
-0.054
-0.16%
jan 1, 1971
33.202
-0.738
-2.18%
jan 1, 1972
34.49
+1.288
3.88%
jan 1, 1973
33.219
-1.271
-3.68%
jan 1, 1974
37.017
+3.798
11.43%
jan 1, 1975
35.295
-1.722
-4.65%
jan 1, 1976
38.351
+3.055
8.66%
jan 1, 1977
39.951
+1.6
4.17%
jan 1, 1978
39.966
+0.015
0.04%
jan 1, 1979
42.259
+2.293
5.74%
jan 1, 1980
41.73
-0.528
-1.25%
jan 1, 1981
40.825
-0.905
-2.17%
jan 1, 1982
42.625
+1.799
4.41%
jan 1, 1983
44.264
+1.639
3.85%
jan 1, 1984
43.669
-0.595
-1.34%
jan 1, 1985
43.108
-0.561
-1.28%
jan 1, 1986
45.058
+1.95
4.52%
jan 1, 1987
46.333
+1.274
2.83%
jan 1, 1988
47.449
+1.116
2.41%
jan 1, 1989
51.737
+4.288
9.04%
jan 1, 1990
53.952
+2.215
4.28%
jan 1, 1991
51.496
-2.456
-4.55%
jan 1, 1992
48.99
-2.507
-4.87%
jan 1, 1993
46.576
-2.413
-4.93%
jan 1, 1994
46.207
-0.369
-0.79%
jan 1, 1995
46.301
+0.094
0.2%
jan 1, 1996
45.761
-0.54
-1.17%
jan 1, 1997
46.389
+0.628
1.37%
jan 1, 1998
44.913
-1.476
-3.18%
jan 1, 1999
43.763
-1.15
-2.56%
jan 1, 2000
47.457
+3.694
8.44%
jan 1, 2001
50.085
+2.629
5.54%
jan 1, 2002
51.401
+1.315
2.63%
jan 1, 2003
51.797
+0.396
0.77%
jan 1, 2004
51.261
-0.536
-1.03%
jan 1, 2005
51.975
+0.714
1.39%
jan 1, 2006
53.531
+1.556
2.99%
jan 1, 2007
54.665
+1.133
2.12%
jan 1, 2008
56.397
+1.733
3.17%
jan 1, 2009
58.386
+1.989
3.53%
jan 1, 2010
61.865
+3.48
5.96%
jan 1, 2011
64.096
+2.23
3.61%
jan 1, 2012
68.507
+4.411
6.88%
jan 1, 2013
67.649
-0.858
-1.25%
jan 1, 2014
67.727
+0.078
0.12%
jan 1, 2015
67.968
+0.241
0.36%
jan 1, 2016
68.587
+0.62
0.91%
Ranking of countries by current statistics by years


Comments: