29
/
en
AIzaSyAYiBZKx7MnpbEhh9jyipgxe19OcubqV5w
April 1, 2024
171477
Kuwait
KWT
true
2
1
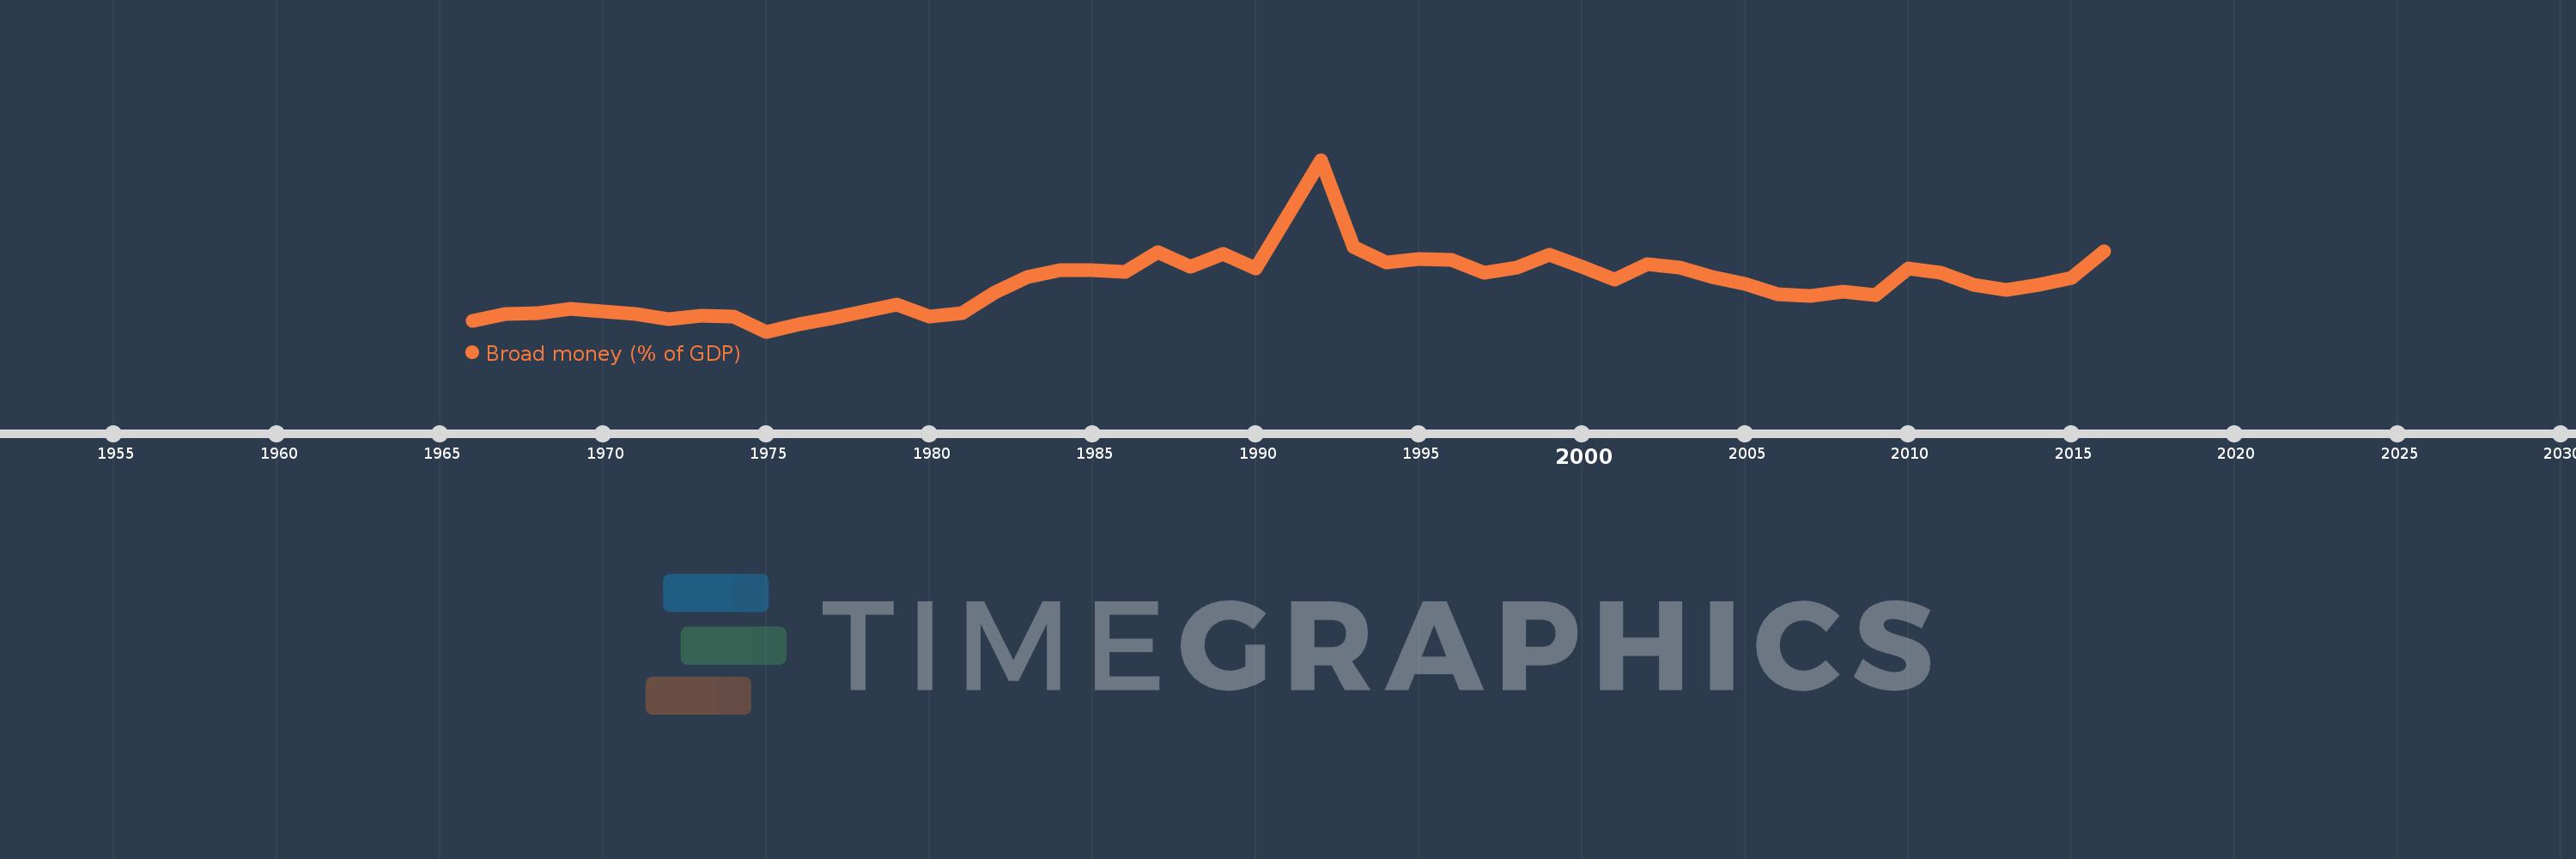
Broad money (% of GDP)
2016,2015,2014,2013,2012,2011,2010,2009,2008,2007,2006,2005,2004,2003,2002,2001,2000,1999,1998,1997,1996,1995,1994,1993,1992,1990,1989,1988,1987,1986,1985,1984,1983,1982,1981,1980,1979,1978,1977,1976,1975,1974,1973,1972,1971,1970,1969,1968,1967,1966
This statistics in other country:
AfghanistanAlbaniaAlgeriaAngolaAntigua and BarbudaArab WorldArgentinaArmeniaArubaAustraliaAzerbaijanBahamas, TheBahrainBangladeshBarbadosBelarusBelizeBeninBhutanBoliviaBosnia and HerzegovinaBotswanaBrazilBrunei DarussalamBulgariaBurkina FasoBurundiCabo VerdeCambodiaCameroonCanadaCaribbean small statesCentral African RepublicCentral Europe and the BalticsChadChileChinaColombiaComorosCongo, Dem. Rep.Congo, Rep.Costa RicaCote d'IvoireCroatiaCzech RepublicDenmarkDjiboutiDominicaDominican RepublicEarly-demographic dividendEast Asia & PacificEast Asia & Pacific (excluding high income)East Asia & Pacific (IDA & IBRD countries)EcuadorEgypt, Arab Rep.El SalvadorEquatorial GuineaEritreaEstoniaEthiopiaEurope & Central Asia (excluding high income)Europe & Central Asia (IDA & IBRD countries)FijiFragile and conflict affected situationsGabonGambia, TheGeorgiaGhanaGrenadaGuatemalaGuineaGuinea-BissauGuyanaHaitiHeavily indebted poor countries (HIPC)High incomeHondurasHong Kong SAR, ChinaHungaryIBRD onlyIcelandIDA & IBRD totalIDA blendIDA onlyIDA totalIndiaIndonesiaIran, Islamic Rep.IraqIsraelJamaicaJapanJordanKazakhstanKenyaKorea, Rep.KuwaitKyrgyz RepublicLao PDRLate-demographic dividendLatin America & Caribbean Latin America & Caribbean (excluding high income)Latin America & the Caribbean (IDA & IBRD countries)LatviaLeast developed countries: UN classificationLebanonLesothoLiberiaLibyaLithuaniaLow & middle incomeLow incomeLower middle incomeMacao SAR, ChinaMacedonia, FYRMadagascarMalawiMalaysiaMaldivesMaliMauritaniaMauritiusMexicoMicronesia, Fed. Sts.Middle East & North AfricaMiddle East & North Africa (excluding high income)Middle East & North Africa (IDA & IBRD countries)Middle incomeMoldovaMongoliaMoroccoMozambiqueMyanmarNamibiaNepalNew ZealandNicaraguaNigerNigeriaNorth AmericaNorwayOECD membersOmanOther small statesPacific island small statesPakistanPanamaPapua New GuineaParaguayPeruPhilippinesPolandPost-demographic dividendPre-demographic dividendQatarRomaniaRussian FederationRwandaSamoaSao Tome and PrincipeSaudi ArabiaSenegalSerbiaSeychellesSierra LeoneSingaporeSlovak RepublicSmall statesSolomon IslandsSouth AfricaSouth AsiaSouth Asia (IDA & IBRD)South SudanSri LankaSt. Kitts and NevisSt. LuciaSt. Vincent and the GrenadinesSub-Saharan Africa Sub-Saharan Africa (excluding high income)Sub-Saharan Africa (IDA & IBRD countries)SudanSurinameSwazilandSwedenSwitzerlandSyrian Arab RepublicTajikistanTanzaniaThailandTimor-LesteTogoTongaTrinidad and TobagoTunisiaTurkeyUgandaUkraineUnited Arab EmiratesUnited KingdomUnited StatesUpper middle incomeUruguayVanuatuVenezuela, RBVietnamWest Bank and GazaWorldYemen, Rep.ZambiaZimbabwe Timeline:
This timeline shows a graph from 1966 to 2016 of Kuwait. No data until 1965. Number of actual observations by date: 50.
Source name:
World Development Indicators
Source organization:
International Monetary Fund, International Financial Statistics and data files, and World Bank and OECD GDP estimates.
Categories, topics:
Financial Sector
Last updated:
apr 23, 2017
Indicators value changes by year
Minimum:
17.954
jan 1, 1975
Maximum:
192.239
jan 1, 1992
At the date of observation
Value
Absolute change
Change from previous value
jan 1, 1966
28.825
+28.825
0.0%
jan 1, 1967
35.738
+6.913
23.98%
jan 1, 1968
36.881
+1.143
3.2%
jan 1, 1969
40.631
+3.75
10.17%
jan 1, 1970
38.332
-2.299
-5.66%
jan 1, 1971
35.652
-2.679
-6.99%
jan 1, 1972
30.308
-5.344
-14.99%
jan 1, 1973
33.716
+3.408
11.24%
jan 1, 1974
33.433
-0.283
-0.84%
jan 1, 1975
17.954
-15.479
-46.3%
jan 1, 1976
25.555
+7.601
42.33%
jan 1, 1977
31.776
+6.221
24.34%
jan 1, 1978
38.721
+6.945
21.86%
jan 1, 1979
45.738
+7.017
18.12%
jan 1, 1980
33.081
-12.656
-27.67%
jan 1, 1981
36.915
+3.834
11.59%
jan 1, 1982
57.855
+20.939
56.72%
jan 1, 1983
73.247
+15.392
26.6%
jan 1, 1984
80.515
+7.269
9.92%
jan 1, 1985
80.465
-0.051
-0.06%
jan 1, 1986
78.912
-1.552
-1.93%
jan 1, 1987
98.226
+19.313
24.47%
jan 1, 1988
84.069
-14.157
-14.41%
jan 1, 1989
96.995
+12.926
15.38%
jan 1, 1990
82.14
-14.854
-15.31%
jan 1, 1992
192.239
+110.099
134.04%
jan 1, 1993
103.982
-88.257
-45.91%
jan 1, 1994
88.468
-15.514
-14.92%
jan 1, 1995
91.367
+2.899
3.28%
jan 1, 1996
90.89
-0.477
-0.52%
jan 1, 1997
77.746
-13.144
-14.46%
jan 1, 1998
82.724
+4.978
6.4%
jan 1, 1999
95.566
+12.842
15.52%
jan 1, 2000
83.738
-11.828
-12.38%
jan 1, 2001
70.555
-13.183
-15.74%
jan 1, 2002
86.053
+15.498
21.97%
jan 1, 2003
83.23
-2.823
-3.28%
jan 1, 2004
72.904
-10.325
-12.41%
jan 1, 2005
66.708
-6.196
-8.5%
jan 1, 2006
55.467
-11.241
-16.85%
jan 1, 2007
54.023
-1.444
-2.6%
jan 1, 2008
58.193
+4.17
7.72%
jan 1, 2009
55.402
-2.791
-4.8%
jan 1, 2010
81.684
+26.283
47.44%
jan 1, 2011
77.494
-4.191
-5.13%
jan 1, 2012
65.268
-12.225
-15.78%
jan 1, 2013
60.631
-4.638
-7.11%
jan 1, 2014
65.645
+5.015
8.27%
jan 1, 2015
72.638
+6.992
10.65%
jan 1, 2016
99.347
+26.709
36.77%
Ranking of countries by current statistics by years


Comments: