29
/
en
AIzaSyAYiBZKx7MnpbEhh9jyipgxe19OcubqV5w
April 1, 2024
221864
Peru
PER
true
2
1
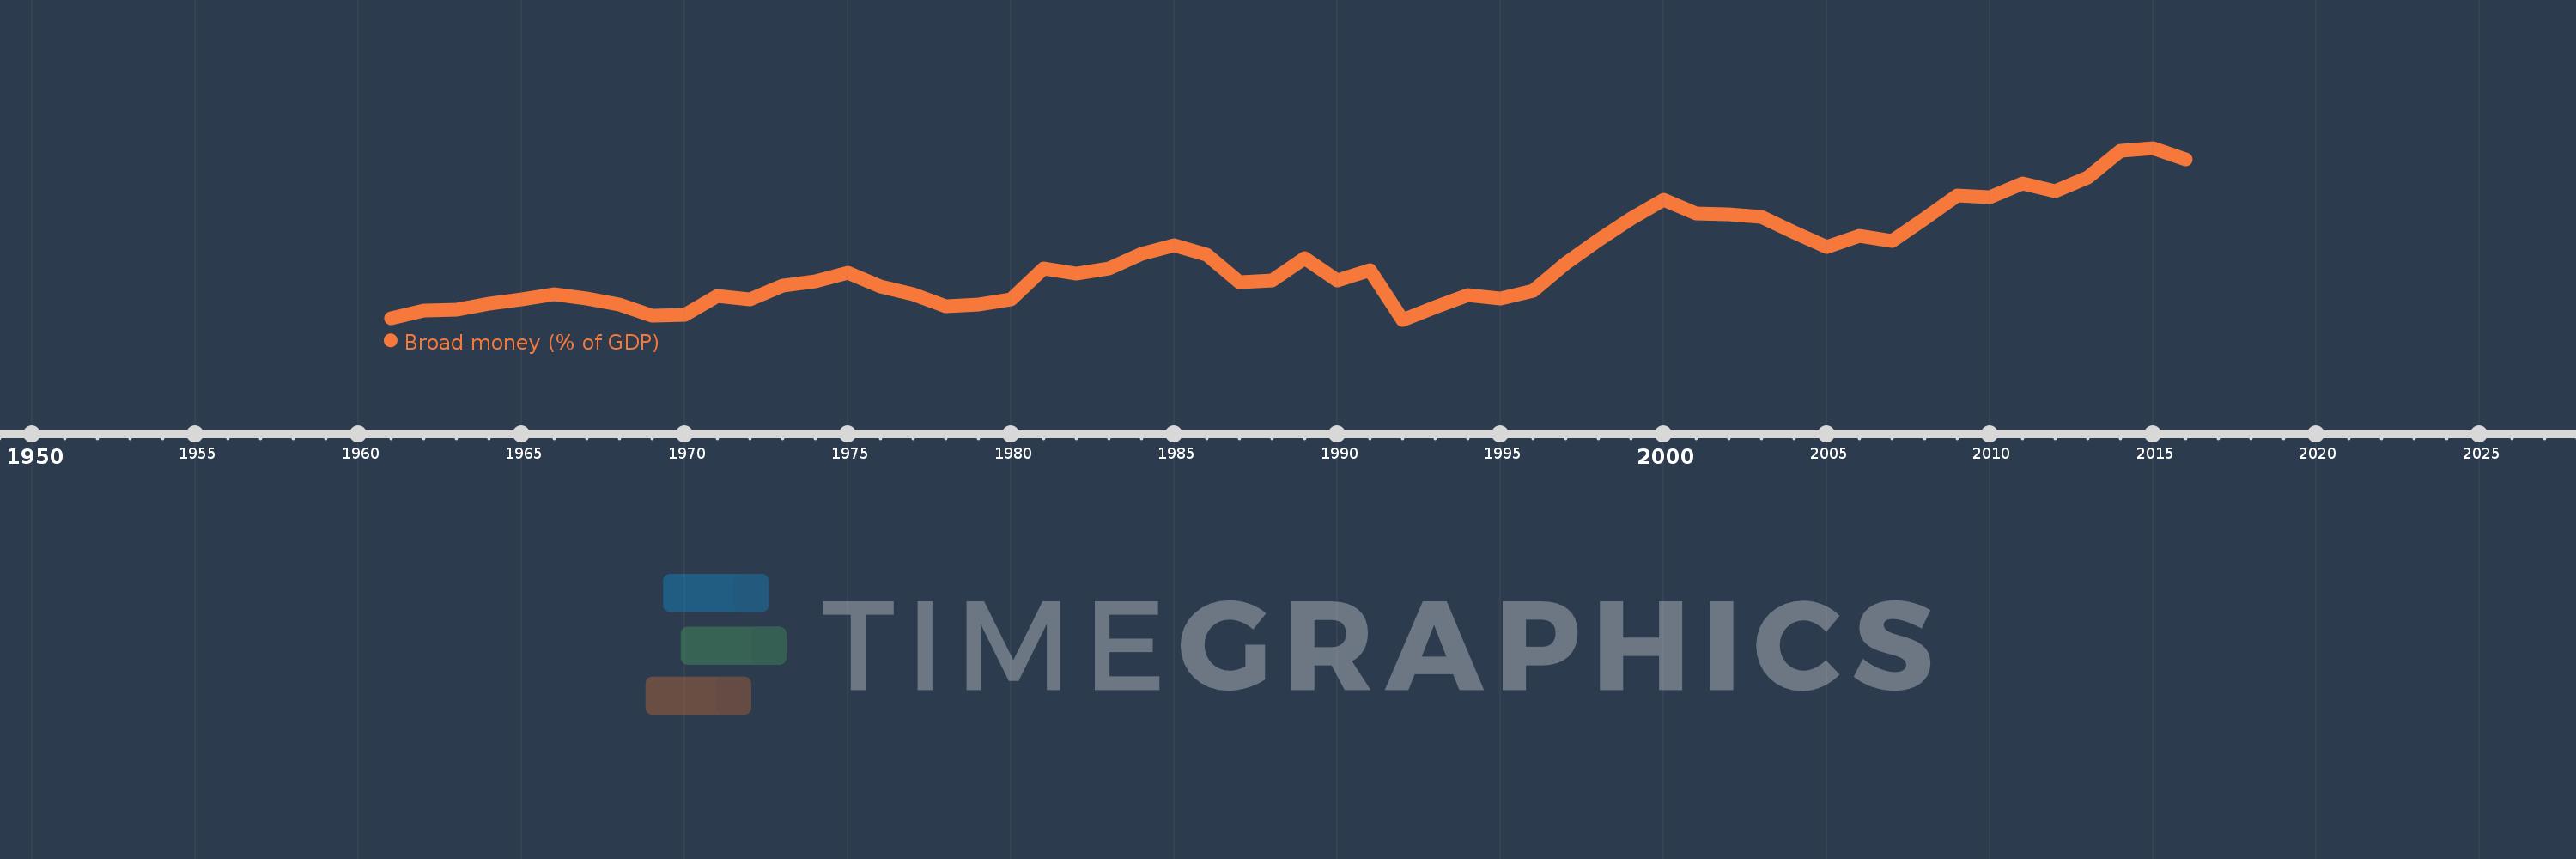
Broad money (% of GDP)
2016,2015,2014,2013,2012,2011,2010,2009,2008,2007,2006,2005,2004,2003,2002,2001,2000,1999,1998,1997,1996,1995,1994,1993,1992,1991,1990,1989,1988,1987,1986,1985,1984,1983,1982,1981,1980,1979,1978,1977,1976,1975,1974,1973,1972,1971,1970,1969,1968,1967,1966,1965,1964,1963,1962,1961
This statistics in other country:
AfghanistanAlbaniaAlgeriaAngolaAntigua and BarbudaArab WorldArgentinaArmeniaArubaAustraliaAzerbaijanBahamas, TheBahrainBangladeshBarbadosBelarusBelizeBeninBhutanBoliviaBosnia and HerzegovinaBotswanaBrazilBrunei DarussalamBulgariaBurkina FasoBurundiCabo VerdeCambodiaCameroonCanadaCaribbean small statesCentral African RepublicCentral Europe and the BalticsChadChileChinaColombiaComorosCongo, Dem. Rep.Congo, Rep.Costa RicaCote d'IvoireCroatiaCzech RepublicDenmarkDjiboutiDominicaDominican RepublicEarly-demographic dividendEast Asia & PacificEast Asia & Pacific (excluding high income)East Asia & Pacific (IDA & IBRD countries)EcuadorEgypt, Arab Rep.El SalvadorEquatorial GuineaEritreaEstoniaEthiopiaEurope & Central Asia (excluding high income)Europe & Central Asia (IDA & IBRD countries)FijiFragile and conflict affected situationsGabonGambia, TheGeorgiaGhanaGrenadaGuatemalaGuineaGuinea-BissauGuyanaHaitiHeavily indebted poor countries (HIPC)High incomeHondurasHong Kong SAR, ChinaHungaryIBRD onlyIcelandIDA & IBRD totalIDA blendIDA onlyIDA totalIndiaIndonesiaIran, Islamic Rep.IraqIsraelJamaicaJapanJordanKazakhstanKenyaKorea, Rep.KuwaitKyrgyz RepublicLao PDRLate-demographic dividendLatin America & Caribbean Latin America & Caribbean (excluding high income)Latin America & the Caribbean (IDA & IBRD countries)LatviaLeast developed countries: UN classificationLebanonLesothoLiberiaLibyaLithuaniaLow & middle incomeLow incomeLower middle incomeMacao SAR, ChinaMacedonia, FYRMadagascarMalawiMalaysiaMaldivesMaliMauritaniaMauritiusMexicoMicronesia, Fed. Sts.Middle East & North AfricaMiddle East & North Africa (excluding high income)Middle East & North Africa (IDA & IBRD countries)Middle incomeMoldovaMongoliaMoroccoMozambiqueMyanmarNamibiaNepalNew ZealandNicaraguaNigerNigeriaNorth AmericaNorwayOECD membersOmanOther small statesPacific island small statesPakistanPanamaPapua New GuineaParaguayPeruPhilippinesPolandPost-demographic dividendPre-demographic dividendQatarRomaniaRussian FederationRwandaSamoaSao Tome and PrincipeSaudi ArabiaSenegalSerbiaSeychellesSierra LeoneSingaporeSlovak RepublicSmall statesSolomon IslandsSouth AfricaSouth AsiaSouth Asia (IDA & IBRD)South SudanSri LankaSt. Kitts and NevisSt. LuciaSt. Vincent and the GrenadinesSub-Saharan Africa Sub-Saharan Africa (excluding high income)Sub-Saharan Africa (IDA & IBRD countries)SudanSurinameSwazilandSwedenSwitzerlandSyrian Arab RepublicTajikistanTanzaniaThailandTimor-LesteTogoTongaTrinidad and TobagoTunisiaTurkeyUgandaUkraineUnited Arab EmiratesUnited KingdomUnited StatesUpper middle incomeUruguayVanuatuVenezuela, RBVietnamWest Bank and GazaWorldYemen, Rep.ZambiaZimbabwe Timeline:
This timeline shows a graph from 1961 to 2016 of Peru. No data until 1960. Number of actual observations by date: 56.
Source name:
World Development Indicators
Source organization:
International Monetary Fund, International Financial Statistics and data files, and World Bank and OECD GDP estimates.
Categories, topics:
Financial Sector
Last updated:
apr 23, 2017
Indicators value changes by year
Minimum:
16.124
jan 1, 1992
Maximum:
43.715
jan 1, 2015
At the date of observation
Value
Absolute change
Change from previous value
jan 1, 1961
16.379
+16.379
0.0%
jan 1, 1962
17.629
+1.251
7.64%
jan 1, 1963
17.71
+0.081
0.46%
jan 1, 1964
18.755
+1.045
5.9%
jan 1, 1965
19.441
+0.685
3.65%
jan 1, 1966
20.221
+0.78
4.01%
jan 1, 1967
19.47
-0.751
-3.71%
jan 1, 1968
18.52
-0.95
-4.88%
jan 1, 1969
16.713
-1.807
-9.76%
jan 1, 1970
16.902
+0.189
1.13%
jan 1, 1971
19.956
+3.054
18.07%
jan 1, 1972
19.357
-0.599
-3.0%
jan 1, 1973
21.652
+2.294
11.85%
jan 1, 1974
22.281
+0.629
2.9%
jan 1, 1975
23.624
+1.343
6.03%
jan 1, 1976
21.462
-2.162
-9.15%
jan 1, 1977
20.223
-1.239
-5.77%
jan 1, 1978
18.348
-1.875
-9.27%
jan 1, 1979
18.54
+0.192
1.04%
jan 1, 1980
19.394
+0.854
4.61%
jan 1, 1981
24.352
+4.959
25.57%
jan 1, 1982
23.539
-0.814
-3.34%
jan 1, 1983
24.34
+0.802
3.41%
jan 1, 1984
26.637
+2.297
9.44%
jan 1, 1985
28.021
+1.384
5.19%
jan 1, 1986
26.506
-1.515
-5.41%
jan 1, 1987
22.153
-4.353
-16.42%
jan 1, 1988
22.458
+0.305
1.38%
jan 1, 1989
26.053
+3.594
16.0%
jan 1, 1990
22.428
-3.625
-13.91%
jan 1, 1991
24.063
+1.635
7.29%
jan 1, 1992
16.124
-7.938
-32.99%
jan 1, 1993
18.111
+1.986
12.32%
jan 1, 1994
20.105
+1.994
11.01%
jan 1, 1995
19.57
-0.534
-2.66%
jan 1, 1996
20.736
+1.166
5.96%
jan 1, 1997
25.239
+4.503
21.72%
jan 1, 1998
28.896
+3.657
14.49%
jan 1, 1999
32.301
+3.405
11.78%
jan 1, 2000
35.398
+3.097
9.59%
jan 1, 2001
33.163
-2.235
-6.31%
jan 1, 2002
32.995
-0.168
-0.51%
jan 1, 2003
32.608
-0.387
-1.17%
jan 1, 2004
30.092
-2.516
-7.71%
jan 1, 2005
27.856
-2.236
-7.43%
jan 1, 2006
29.651
+1.794
6.44%
jan 1, 2007
28.706
-0.945
-3.19%
jan 1, 2008
32.35
+3.644
12.69%
jan 1, 2009
36.029
+3.679
11.37%
jan 1, 2010
35.845
-0.184
-0.51%
jan 1, 2011
38.081
+2.236
6.24%
jan 1, 2012
36.759
-1.322
-3.47%
jan 1, 2013
38.928
+2.169
5.9%
jan 1, 2014
43.311
+4.383
11.26%
jan 1, 2015
43.715
+0.404
0.93%
jan 1, 2016
41.895
-1.82
-4.16%
Ranking of countries by current statistics by years


Comments: