29
/
en
AIzaSyAYiBZKx7MnpbEhh9jyipgxe19OcubqV5w
April 1, 2024
239003
Sierra Leone
SLE
true
2
1
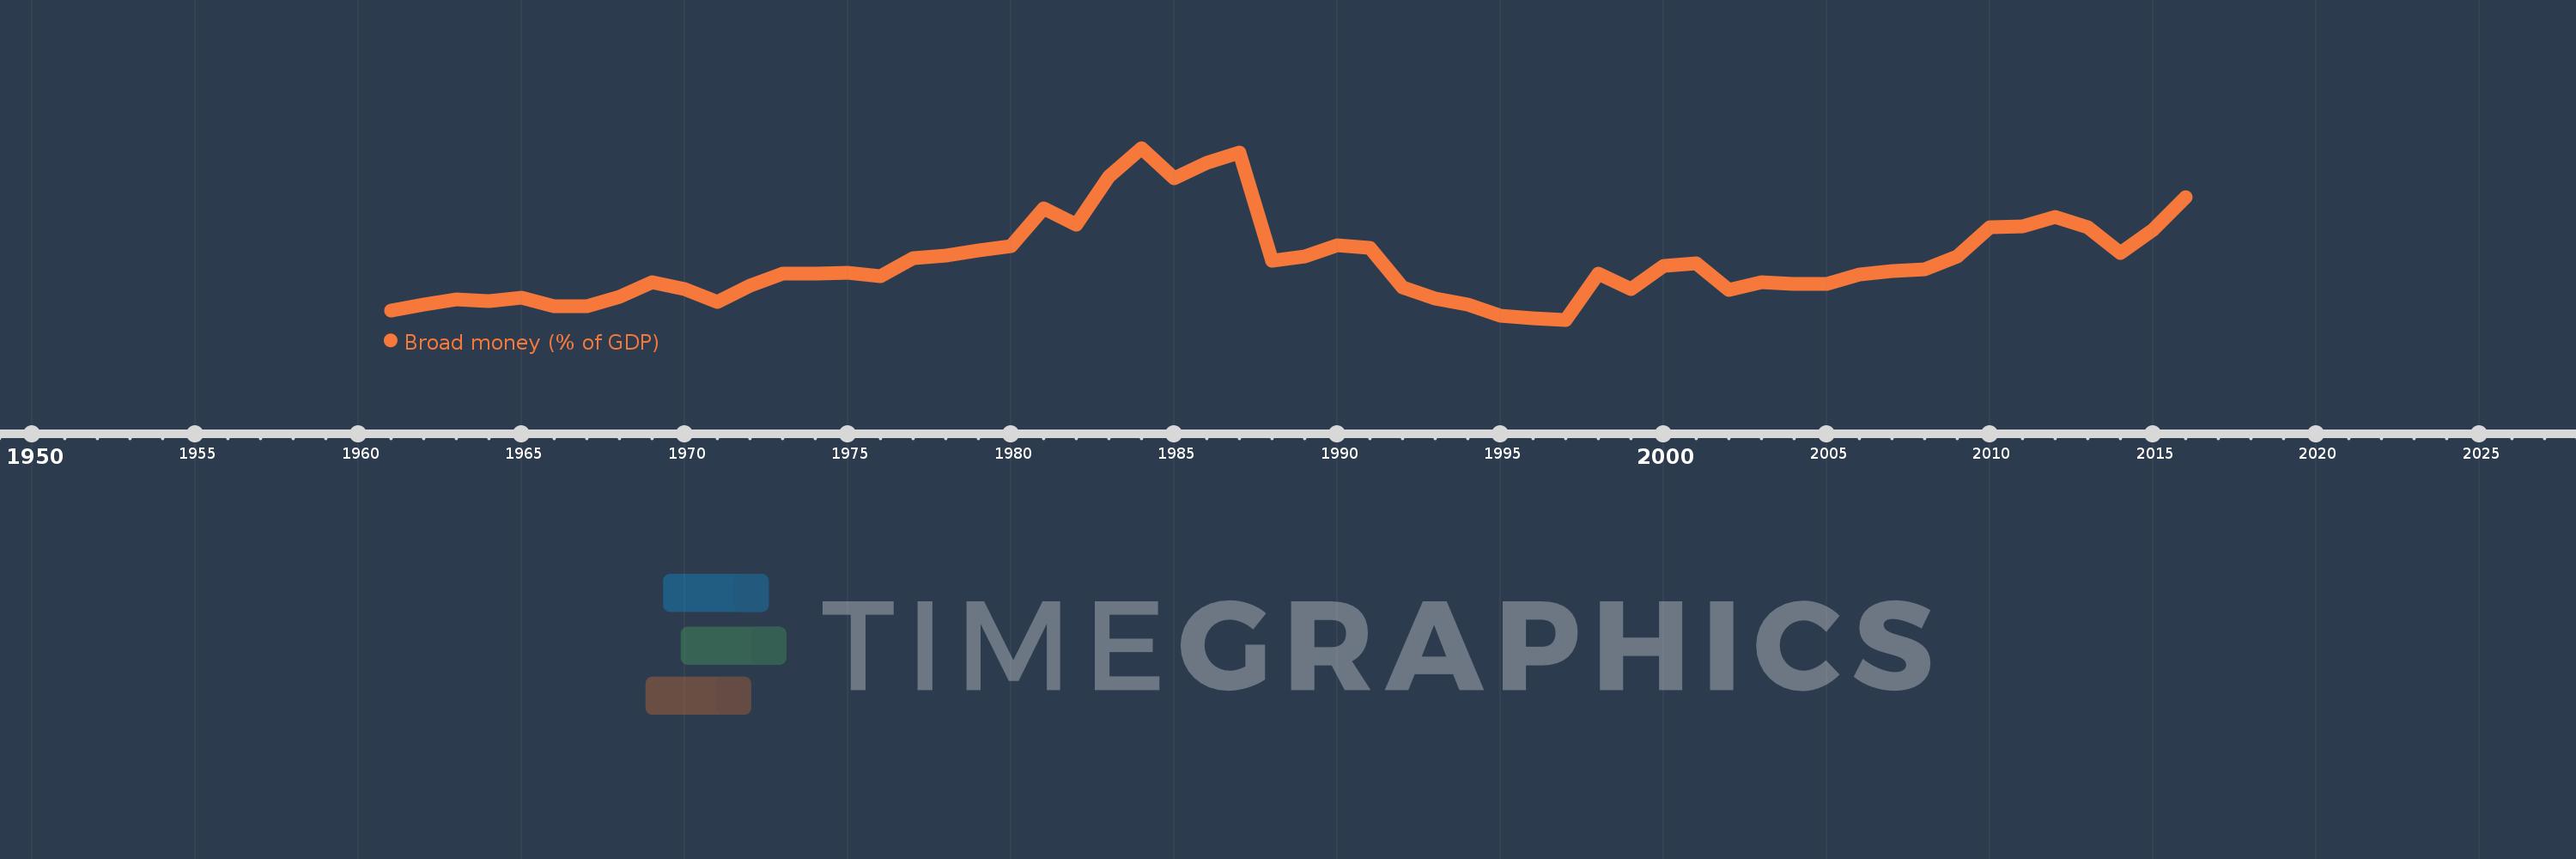
Broad money (% of GDP)
2016,2015,2014,2013,2012,2011,2010,2009,2008,2007,2006,2005,2004,2003,2002,2001,2000,1999,1998,1997,1996,1995,1994,1993,1992,1991,1990,1989,1988,1987,1986,1985,1984,1983,1982,1981,1980,1979,1978,1977,1976,1975,1974,1973,1972,1971,1970,1969,1968,1967,1966,1965,1964,1963,1962,1961
This statistics in other country:
AfghanistanAlbaniaAlgeriaAngolaAntigua and BarbudaArab WorldArgentinaArmeniaArubaAustraliaAzerbaijanBahamas, TheBahrainBangladeshBarbadosBelarusBelizeBeninBhutanBoliviaBosnia and HerzegovinaBotswanaBrazilBrunei DarussalamBulgariaBurkina FasoBurundiCabo VerdeCambodiaCameroonCanadaCaribbean small statesCentral African RepublicCentral Europe and the BalticsChadChileChinaColombiaComorosCongo, Dem. Rep.Congo, Rep.Costa RicaCote d'IvoireCroatiaCzech RepublicDenmarkDjiboutiDominicaDominican RepublicEarly-demographic dividendEast Asia & PacificEast Asia & Pacific (excluding high income)East Asia & Pacific (IDA & IBRD countries)EcuadorEgypt, Arab Rep.El SalvadorEquatorial GuineaEritreaEstoniaEthiopiaEurope & Central Asia (excluding high income)Europe & Central Asia (IDA & IBRD countries)FijiFragile and conflict affected situationsGabonGambia, TheGeorgiaGhanaGrenadaGuatemalaGuineaGuinea-BissauGuyanaHaitiHeavily indebted poor countries (HIPC)High incomeHondurasHong Kong SAR, ChinaHungaryIBRD onlyIcelandIDA & IBRD totalIDA blendIDA onlyIDA totalIndiaIndonesiaIran, Islamic Rep.IraqIsraelJamaicaJapanJordanKazakhstanKenyaKorea, Rep.KuwaitKyrgyz RepublicLao PDRLate-demographic dividendLatin America & Caribbean Latin America & Caribbean (excluding high income)Latin America & the Caribbean (IDA & IBRD countries)LatviaLeast developed countries: UN classificationLebanonLesothoLiberiaLibyaLithuaniaLow & middle incomeLow incomeLower middle incomeMacao SAR, ChinaMacedonia, FYRMadagascarMalawiMalaysiaMaldivesMaliMauritaniaMauritiusMexicoMicronesia, Fed. Sts.Middle East & North AfricaMiddle East & North Africa (excluding high income)Middle East & North Africa (IDA & IBRD countries)Middle incomeMoldovaMongoliaMoroccoMozambiqueMyanmarNamibiaNepalNew ZealandNicaraguaNigerNigeriaNorth AmericaNorwayOECD membersOmanOther small statesPacific island small statesPakistanPanamaPapua New GuineaParaguayPeruPhilippinesPolandPost-demographic dividendPre-demographic dividendQatarRomaniaRussian FederationRwandaSamoaSao Tome and PrincipeSaudi ArabiaSenegalSerbiaSeychellesSierra LeoneSingaporeSlovak RepublicSmall statesSolomon IslandsSouth AfricaSouth AsiaSouth Asia (IDA & IBRD)South SudanSri LankaSt. Kitts and NevisSt. LuciaSt. Vincent and the GrenadinesSub-Saharan Africa Sub-Saharan Africa (excluding high income)Sub-Saharan Africa (IDA & IBRD countries)SudanSurinameSwazilandSwedenSwitzerlandSyrian Arab RepublicTajikistanTanzaniaThailandTimor-LesteTogoTongaTrinidad and TobagoTunisiaTurkeyUgandaUkraineUnited Arab EmiratesUnited KingdomUnited StatesUpper middle incomeUruguayVanuatuVenezuela, RBVietnamWest Bank and GazaWorldYemen, Rep.ZambiaZimbabwe Timeline:
This timeline shows a graph from 1961 to 2016 of Sierra Leone. No data until 1960. Number of actual observations by date: 56.
Source name:
World Development Indicators
Source organization:
International Monetary Fund, International Financial Statistics and data files, and World Bank and OECD GDP estimates.
Categories, topics:
Financial Sector
Last updated:
apr 23, 2017
Indicators value changes by year
Maximum:
29.442
jan 1, 1984
At the date of observation
Value
Absolute change
Change from previous value
jan 1, 1961
10.941
+10.941
0.0%
jan 1, 1962
11.658
+0.717
6.56%
jan 1, 1963
12.2
+0.542
4.65%
jan 1, 1964
12.024
-0.176
-1.44%
jan 1, 1965
12.408
+0.384
3.19%
jan 1, 1966
11.504
-0.905
-7.29%
jan 1, 1967
11.503
-0.001
-0.01%
jan 1, 1968
12.486
+0.984
8.55%
jan 1, 1969
14.199
+1.713
13.72%
jan 1, 1970
13.451
-0.748
-5.27%
jan 1, 1971
11.947
-1.504
-11.18%
jan 1, 1972
13.781
+1.834
15.35%
jan 1, 1973
15.164
+1.383
10.03%
jan 1, 1974
15.177
+0.014
0.09%
jan 1, 1975
15.239
+0.061
0.4%
jan 1, 1976
14.915
-0.323
-2.12%
jan 1, 1977
16.907
+1.992
13.36%
jan 1, 1978
17.175
+0.268
1.58%
jan 1, 1979
17.823
+0.648
3.77%
jan 1, 1980
18.296
+0.472
2.65%
jan 1, 1981
22.569
+4.274
23.36%
jan 1, 1982
20.711
-1.858
-8.23%
jan 1, 1983
26.154
+5.443
26.28%
jan 1, 1984
29.442
+3.289
12.57%
jan 1, 1985
25.966
-3.476
-11.81%
jan 1, 1986
27.781
+1.815
6.99%
jan 1, 1987
28.963
+1.182
4.26%
jan 1, 1988
16.675
-12.288
-42.43%
jan 1, 1989
17.136
+0.461
2.76%
jan 1, 1990
18.35
+1.214
7.09%
jan 1, 1991
18.11
-0.24
-1.31%
jan 1, 1992
13.63
-4.481
-24.74%
jan 1, 1993
12.319
-1.311
-9.62%
jan 1, 1994
11.69
-0.629
-5.1%
jan 1, 1995
10.373
-1.317
-11.27%
jan 1, 1996
10.095
-0.278
-2.68%
jan 1, 1997
9.926
-0.169
-1.67%
jan 1, 1998
15.175
+5.249
52.88%
jan 1, 1999
13.402
-1.773
-11.68%
jan 1, 2000
16.077
+2.675
19.96%
jan 1, 2001
16.357
+0.281
1.75%
jan 1, 2002
13.318
-3.039
-18.58%
jan 1, 2003
14.173
+0.855
6.42%
jan 1, 2004
13.968
-0.205
-1.45%
jan 1, 2005
13.978
+0.01
0.07%
jan 1, 2006
15.067
+1.089
7.79%
jan 1, 2007
15.442
+0.376
2.49%
jan 1, 2008
15.671
+0.228
1.48%
jan 1, 2009
17.105
+1.434
9.15%
jan 1, 2010
20.39
+3.285
19.21%
jan 1, 2011
20.503
+0.112
0.55%
jan 1, 2012
21.617
+1.114
5.43%
jan 1, 2013
20.433
-1.184
-5.48%
jan 1, 2014
17.521
-2.913
-14.25%
jan 1, 2015
20.136
+2.615
14.93%
jan 1, 2016
23.822
+3.686
18.31%
Ranking of countries by current statistics by years


Comments: