29
/
en
AIzaSyAYiBZKx7MnpbEhh9jyipgxe19OcubqV5w
April 1, 2024
24706
Caribbean small states
CSS
false
2
1
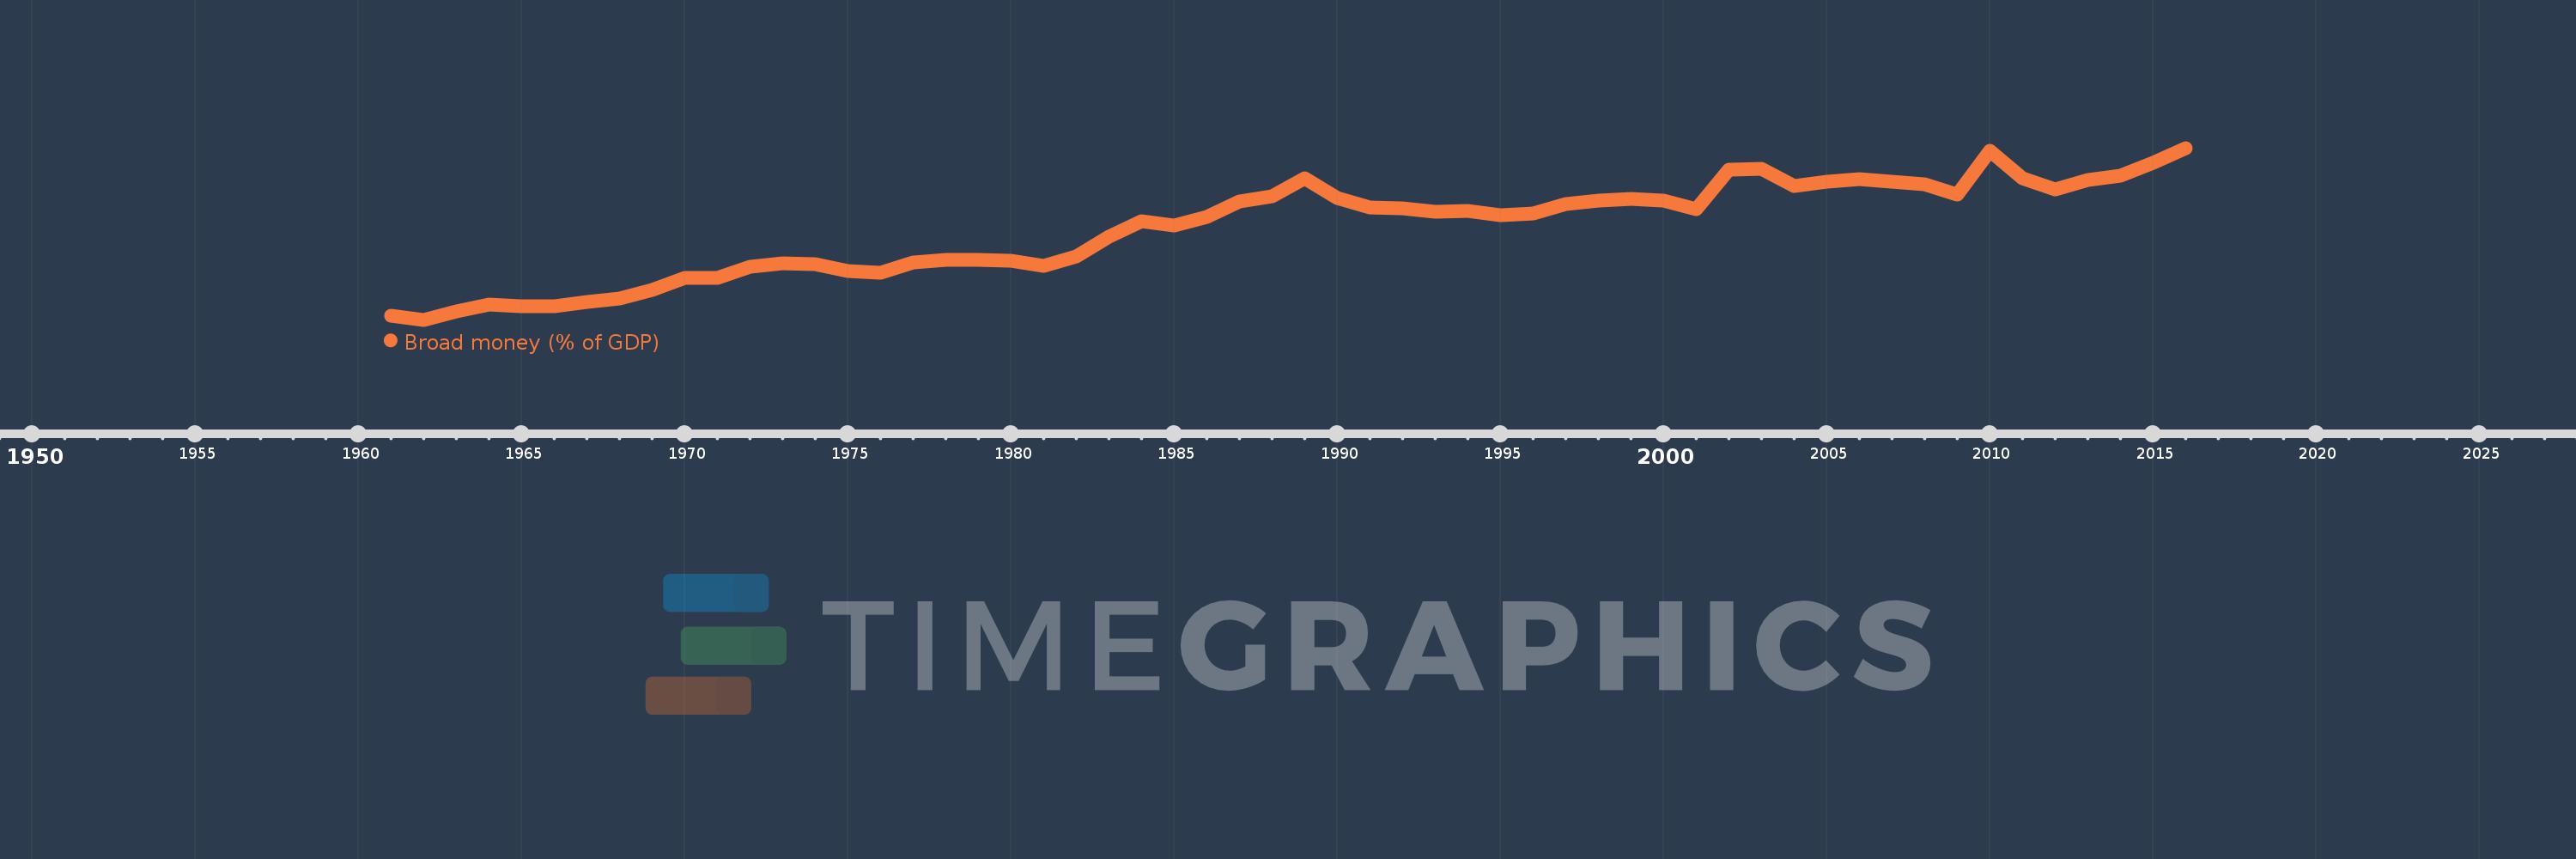
Broad money (% of GDP)
2016,2015,2014,2013,2012,2011,2010,2009,2008,2007,2006,2005,2004,2003,2002,2001,2000,1999,1998,1997,1996,1995,1994,1993,1992,1991,1990,1989,1988,1987,1986,1985,1984,1983,1982,1981,1980,1979,1978,1977,1976,1975,1974,1973,1972,1971,1970,1969,1968,1967,1966,1965,1964,1963,1962,1961
This statistics in other country:
AfghanistanAlbaniaAlgeriaAngolaAntigua and BarbudaArab WorldArgentinaArmeniaArubaAustraliaAzerbaijanBahamas, TheBahrainBangladeshBarbadosBelarusBelizeBeninBhutanBoliviaBosnia and HerzegovinaBotswanaBrazilBrunei DarussalamBulgariaBurkina FasoBurundiCabo VerdeCambodiaCameroonCanadaCaribbean small statesCentral African RepublicCentral Europe and the BalticsChadChileChinaColombiaComorosCongo, Dem. Rep.Congo, Rep.Costa RicaCote d'IvoireCroatiaCzech RepublicDenmarkDjiboutiDominicaDominican RepublicEarly-demographic dividendEast Asia & PacificEast Asia & Pacific (excluding high income)East Asia & Pacific (IDA & IBRD countries)EcuadorEgypt, Arab Rep.El SalvadorEquatorial GuineaEritreaEstoniaEthiopiaEurope & Central Asia (excluding high income)Europe & Central Asia (IDA & IBRD countries)FijiFragile and conflict affected situationsGabonGambia, TheGeorgiaGhanaGrenadaGuatemalaGuineaGuinea-BissauGuyanaHaitiHeavily indebted poor countries (HIPC)High incomeHondurasHong Kong SAR, ChinaHungaryIBRD onlyIcelandIDA & IBRD totalIDA blendIDA onlyIDA totalIndiaIndonesiaIran, Islamic Rep.IraqIsraelJamaicaJapanJordanKazakhstanKenyaKorea, Rep.KuwaitKyrgyz RepublicLao PDRLate-demographic dividendLatin America & Caribbean Latin America & Caribbean (excluding high income)Latin America & the Caribbean (IDA & IBRD countries)LatviaLeast developed countries: UN classificationLebanonLesothoLiberiaLibyaLithuaniaLow & middle incomeLow incomeLower middle incomeMacao SAR, ChinaMacedonia, FYRMadagascarMalawiMalaysiaMaldivesMaliMauritaniaMauritiusMexicoMicronesia, Fed. Sts.Middle East & North AfricaMiddle East & North Africa (excluding high income)Middle East & North Africa (IDA & IBRD countries)Middle incomeMoldovaMongoliaMoroccoMozambiqueMyanmarNamibiaNepalNew ZealandNicaraguaNigerNigeriaNorth AmericaNorwayOECD membersOmanOther small statesPacific island small statesPakistanPanamaPapua New GuineaParaguayPeruPhilippinesPolandPost-demographic dividendPre-demographic dividendQatarRomaniaRussian FederationRwandaSamoaSao Tome and PrincipeSaudi ArabiaSenegalSerbiaSeychellesSierra LeoneSingaporeSlovak RepublicSmall statesSolomon IslandsSouth AfricaSouth AsiaSouth Asia (IDA & IBRD)South SudanSri LankaSt. Kitts and NevisSt. LuciaSt. Vincent and the GrenadinesSub-Saharan Africa Sub-Saharan Africa (excluding high income)Sub-Saharan Africa (IDA & IBRD countries)SudanSurinameSwazilandSwedenSwitzerlandSyrian Arab RepublicTajikistanTanzaniaThailandTimor-LesteTogoTongaTrinidad and TobagoTunisiaTurkeyUgandaUkraineUnited Arab EmiratesUnited KingdomUnited StatesUpper middle incomeUruguayVanuatuVenezuela, RBVietnamWest Bank and GazaWorldYemen, Rep.ZambiaZimbabwe Timeline:
This timeline shows a graph from 1961 to 2016 of Caribbean small states. No data until 1960. Number of actual observations by date: 56.
Source name:
World Development Indicators
Source organization:
International Monetary Fund, International Financial Statistics and data files, and World Bank and OECD GDP estimates.
Categories, topics:
Financial Sector
Last updated:
apr 23, 2017
Indicators value changes by year
Minimum:
19.719
jan 1, 1962
Maximum:
69.711
jan 1, 2016
At the date of observation
Value
Absolute change
Change from previous value
jan 1, 1961
20.965
+20.965
0.0%
jan 1, 1962
19.719
-1.246
-5.94%
jan 1, 1963
22.03
+2.311
11.72%
jan 1, 1964
24.058
+2.029
9.21%
jan 1, 1965
23.673
-0.386
-1.6%
jan 1, 1966
23.573
-0.1
-0.42%
jan 1, 1967
24.983
+1.41
5.98%
jan 1, 1968
25.781
+0.798
3.19%
jan 1, 1969
28.385
+2.604
10.1%
jan 1, 1970
31.973
+3.588
12.64%
jan 1, 1971
32.015
+0.042
0.13%
jan 1, 1972
35.149
+3.134
9.79%
jan 1, 1973
36.188
+1.039
2.96%
jan 1, 1974
35.905
-0.282
-0.78%
jan 1, 1975
33.874
-2.032
-5.66%
jan 1, 1976
33.412
-0.462
-1.36%
jan 1, 1977
36.516
+3.104
9.29%
jan 1, 1978
37.236
+0.72
1.97%
jan 1, 1979
37.238
+0.002
0.0%
jan 1, 1980
36.954
-0.284
-0.76%
jan 1, 1981
35.28
-1.674
-4.53%
jan 1, 1982
38.261
+2.981
8.45%
jan 1, 1983
43.837
+5.576
14.57%
jan 1, 1984
48.503
+4.666
10.64%
jan 1, 1985
47.108
-1.395
-2.88%
jan 1, 1986
49.716
+2.608
5.54%
jan 1, 1987
54.244
+4.528
9.11%
jan 1, 1988
55.601
+1.357
2.5%
jan 1, 1989
60.946
+5.345
9.61%
jan 1, 1990
55.065
-5.881
-9.65%
jan 1, 1991
52.329
-2.736
-4.97%
jan 1, 1992
52.241
-0.087
-0.17%
jan 1, 1993
51.054
-1.187
-2.27%
jan 1, 1994
51.331
+0.277
0.54%
jan 1, 1995
50.197
-1.134
-2.21%
jan 1, 1996
50.724
+0.527
1.05%
jan 1, 1997
53.296
+2.572
5.07%
jan 1, 1998
54.463
+1.167
2.19%
jan 1, 1999
54.936
+0.473
0.87%
jan 1, 2000
54.289
-0.647
-1.18%
jan 1, 2001
51.835
-2.454
-4.52%
jan 1, 2002
63.425
+11.59
22.36%
jan 1, 2003
63.539
+0.114
0.18%
jan 1, 2004
58.67
-4.869
-7.66%
jan 1, 2005
60.007
+1.337
2.28%
jan 1, 2006
60.744
+0.738
1.23%
jan 1, 2007
59.95
-0.794
-1.31%
jan 1, 2008
59.232
-0.718
-1.2%
jan 1, 2009
56.084
-3.148
-5.31%
jan 1, 2010
68.942
+12.858
22.93%
jan 1, 2011
60.805
-8.137
-11.8%
jan 1, 2012
57.555
-3.25
-5.35%
jan 1, 2013
60.334
+2.779
4.83%
jan 1, 2014
61.685
+1.351
2.24%
jan 1, 2015
65.491
+3.805
6.17%
jan 1, 2016
69.711
+4.22
6.44%
Ranking of countries by current statistics by years


Comments: