29
/
en
AIzaSyAYiBZKx7MnpbEhh9jyipgxe19OcubqV5w
April 1, 2024
37179
IDA & IBRD total
IBT
false
2
1
Broad money (% of GDP)
2016,2015,2014,2013,2012,2011,2010,2009,2008,2007,2006,2005,2004,2003,2002,2001,2000,1999,1998,1997,1996,1995,1994,1993,1992,1991,1990,1989,1988,1987,1986,1985,1984,1983,1982,1981,1980,1979,1978,1977,1976,1975,1974,1973,1972,1971,1970,1969,1968,1967,1966,1965,1964,1963
This statistics in other country:
AfghanistanAlbaniaAlgeriaAngolaAntigua and BarbudaArab WorldArgentinaArmeniaArubaAustraliaAzerbaijanBahamas, TheBahrainBangladeshBarbadosBelarusBelizeBeninBhutanBoliviaBosnia and HerzegovinaBotswanaBrazilBrunei DarussalamBulgariaBurkina FasoBurundiCabo VerdeCambodiaCameroonCanadaCaribbean small statesCentral African RepublicCentral Europe and the BalticsChadChileChinaColombiaComorosCongo, Dem. Rep.Congo, Rep.Costa RicaCote d'IvoireCroatiaCzech RepublicDenmarkDjiboutiDominicaDominican RepublicEarly-demographic dividendEast Asia & PacificEast Asia & Pacific (excluding high income)East Asia & Pacific (IDA & IBRD countries)EcuadorEgypt, Arab Rep.El SalvadorEquatorial GuineaEritreaEstoniaEthiopiaEurope & Central Asia (excluding high income)Europe & Central Asia (IDA & IBRD countries)FijiFragile and conflict affected situationsGabonGambia, TheGeorgiaGhanaGrenadaGuatemalaGuineaGuinea-BissauGuyanaHaitiHeavily indebted poor countries (HIPC)High incomeHondurasHong Kong SAR, ChinaHungaryIBRD onlyIcelandIDA & IBRD totalIDA blendIDA onlyIDA totalIndiaIndonesiaIran, Islamic Rep.IraqIsraelJamaicaJapanJordanKazakhstanKenyaKorea, Rep.KuwaitKyrgyz RepublicLao PDRLate-demographic dividendLatin America & Caribbean Latin America & Caribbean (excluding high income)Latin America & the Caribbean (IDA & IBRD countries)LatviaLeast developed countries: UN classificationLebanonLesothoLiberiaLibyaLithuaniaLow & middle incomeLow incomeLower middle incomeMacao SAR, ChinaMacedonia, FYRMadagascarMalawiMalaysiaMaldivesMaliMauritaniaMauritiusMexicoMicronesia, Fed. Sts.Middle East & North AfricaMiddle East & North Africa (excluding high income)Middle East & North Africa (IDA & IBRD countries)Middle incomeMoldovaMongoliaMoroccoMozambiqueMyanmarNamibiaNepalNew ZealandNicaraguaNigerNigeriaNorth AmericaNorwayOECD membersOmanOther small statesPacific island small statesPakistanPanamaPapua New GuineaParaguayPeruPhilippinesPolandPost-demographic dividendPre-demographic dividendQatarRomaniaRussian FederationRwandaSamoaSao Tome and PrincipeSaudi ArabiaSenegalSerbiaSeychellesSierra LeoneSingaporeSlovak RepublicSmall statesSolomon IslandsSouth AfricaSouth AsiaSouth Asia (IDA & IBRD)South SudanSri LankaSt. Kitts and NevisSt. LuciaSt. Vincent and the GrenadinesSub-Saharan Africa Sub-Saharan Africa (excluding high income)Sub-Saharan Africa (IDA & IBRD countries)SudanSurinameSwazilandSwedenSwitzerlandSyrian Arab RepublicTajikistanTanzaniaThailandTimor-LesteTogoTongaTrinidad and TobagoTunisiaTurkeyUgandaUkraineUnited Arab EmiratesUnited KingdomUnited StatesUpper middle incomeUruguayVanuatuVenezuela, RBVietnamWest Bank and GazaWorldYemen, Rep.ZambiaZimbabwe Timeline:
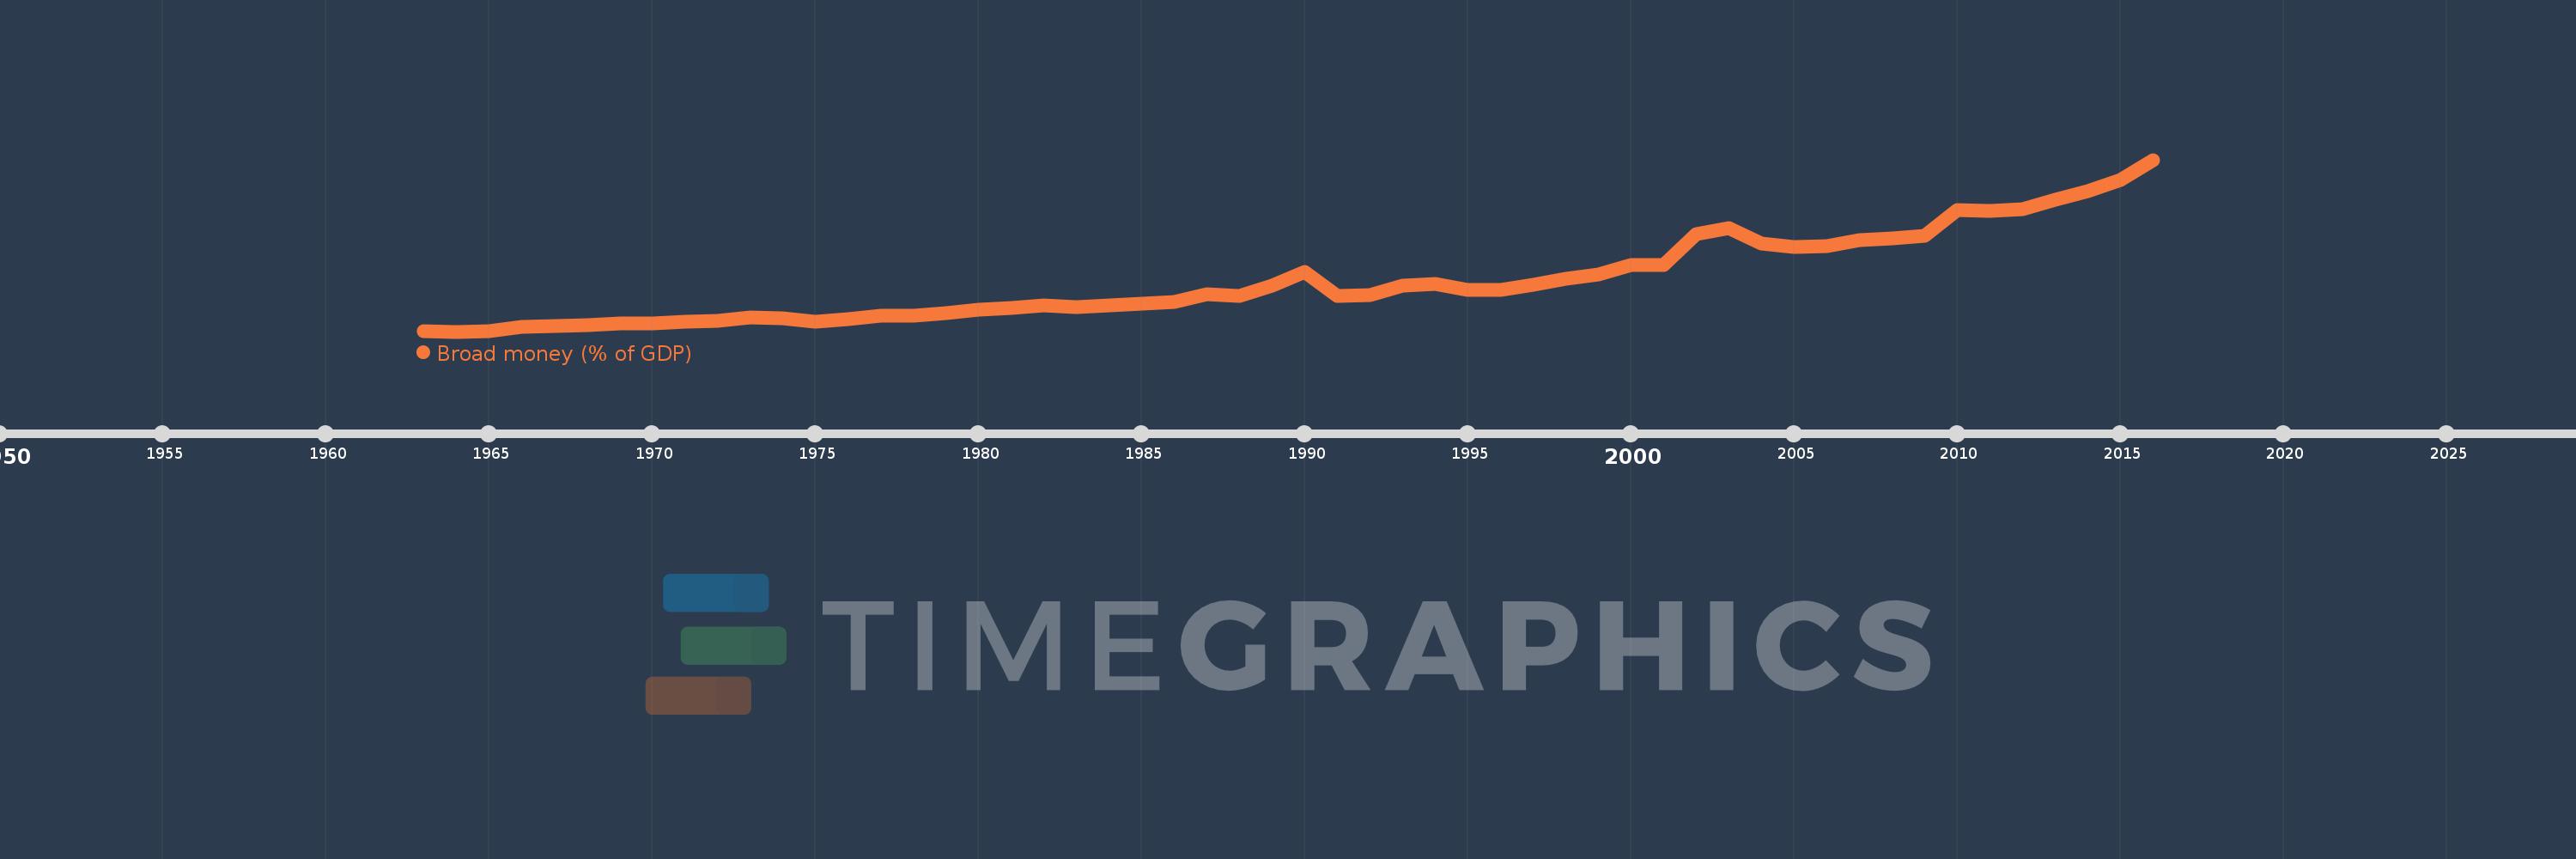
This timeline shows a graph from 1963 to 2016 of IDA & IBRD total. No data until 1962. Number of actual observations by date: 54.
Source name:
World Development Indicators
Source organization:
International Monetary Fund, International Financial Statistics and data files, and World Bank and OECD GDP estimates.
Categories, topics:
Financial Sector
Last updated:
apr 23, 2017
Indicators value changes by year
Minimum:
20.652
jan 1, 1964
Maximum:
124.047
jan 1, 2016
At the date of observation
Value
Absolute change
Change from previous value
jan 1, 1963
20.956
+20.956
0.0%
jan 1, 1964
20.652
-0.304
-1.45%
jan 1, 1965
20.695
+0.043
0.21%
jan 1, 1966
23.734
+3.039
14.68%
jan 1, 1967
24.103
+0.369
1.55%
jan 1, 1968
24.478
+0.375
1.56%
jan 1, 1969
25.507
+1.029
4.2%
jan 1, 1970
25.71
+0.203
0.8%
jan 1, 1971
26.342
+0.632
2.46%
jan 1, 1972
27.286
+0.944
3.59%
jan 1, 1973
28.981
+1.694
6.21%
jan 1, 1974
28.666
-0.315
-1.09%
jan 1, 1975
26.69
-1.976
-6.89%
jan 1, 1976
28.334
+1.644
6.16%
jan 1, 1977
30.319
+1.984
7.0%
jan 1, 1978
30.085
-0.233
-0.77%
jan 1, 1979
31.888
+1.802
5.99%
jan 1, 1980
33.691
+1.803
5.65%
jan 1, 1981
34.9
+1.209
3.59%
jan 1, 1982
36.181
+1.281
3.67%
jan 1, 1983
35.22
-0.961
-2.66%
jan 1, 1984
36.431
+1.211
3.44%
jan 1, 1985
37.431
+1.0
2.74%
jan 1, 1986
38.367
+0.937
2.5%
jan 1, 1987
43.136
+4.768
12.43%
jan 1, 1988
42.277
-0.859
-1.99%
jan 1, 1989
48.267
+5.99
14.17%
jan 1, 1990
56.398
+8.131
16.85%
jan 1, 1991
42.096
-14.303
-25.36%
jan 1, 1992
42.531
+0.436
1.04%
jan 1, 1993
48.188
+5.657
13.3%
jan 1, 1994
49.326
+1.137
2.36%
jan 1, 1995
45.602
-3.724
-7.55%
jan 1, 1996
45.676
+0.074
0.16%
jan 1, 1997
48.653
+2.977
6.52%
jan 1, 1998
52.198
+3.545
7.29%
jan 1, 1999
55.226
+3.028
5.8%
jan 1, 2000
60.795
+5.568
10.08%
jan 1, 2001
60.499
-0.295
-0.49%
jan 1, 2002
79.494
+18.995
31.4%
jan 1, 2003
83.173
+3.679
4.63%
jan 1, 2004
73.512
-9.662
-11.62%
jan 1, 2005
71.495
-2.017
-2.74%
jan 1, 2006
72.063
+0.568
0.79%
jan 1, 2007
75.666
+3.603
5.0%
jan 1, 2008
76.976
+1.31
1.73%
jan 1, 2009
78.399
+1.423
1.85%
jan 1, 2010
94.006
+15.607
19.91%
jan 1, 2011
93.05
-0.956
-1.02%
jan 1, 2012
94.39
+1.34
1.44%
jan 1, 2013
100.25
+5.86
6.21%
jan 1, 2014
105.417
+5.167
5.15%
jan 1, 2015
111.687
+6.27
5.95%
jan 1, 2016
124.047
+12.36
11.07%
Ranking of countries by current statistics by years


Comments: