29
/
en
AIzaSyAYiBZKx7MnpbEhh9jyipgxe19OcubqV5w
April 1, 2024
106921
Colombia
COL
true
2
1
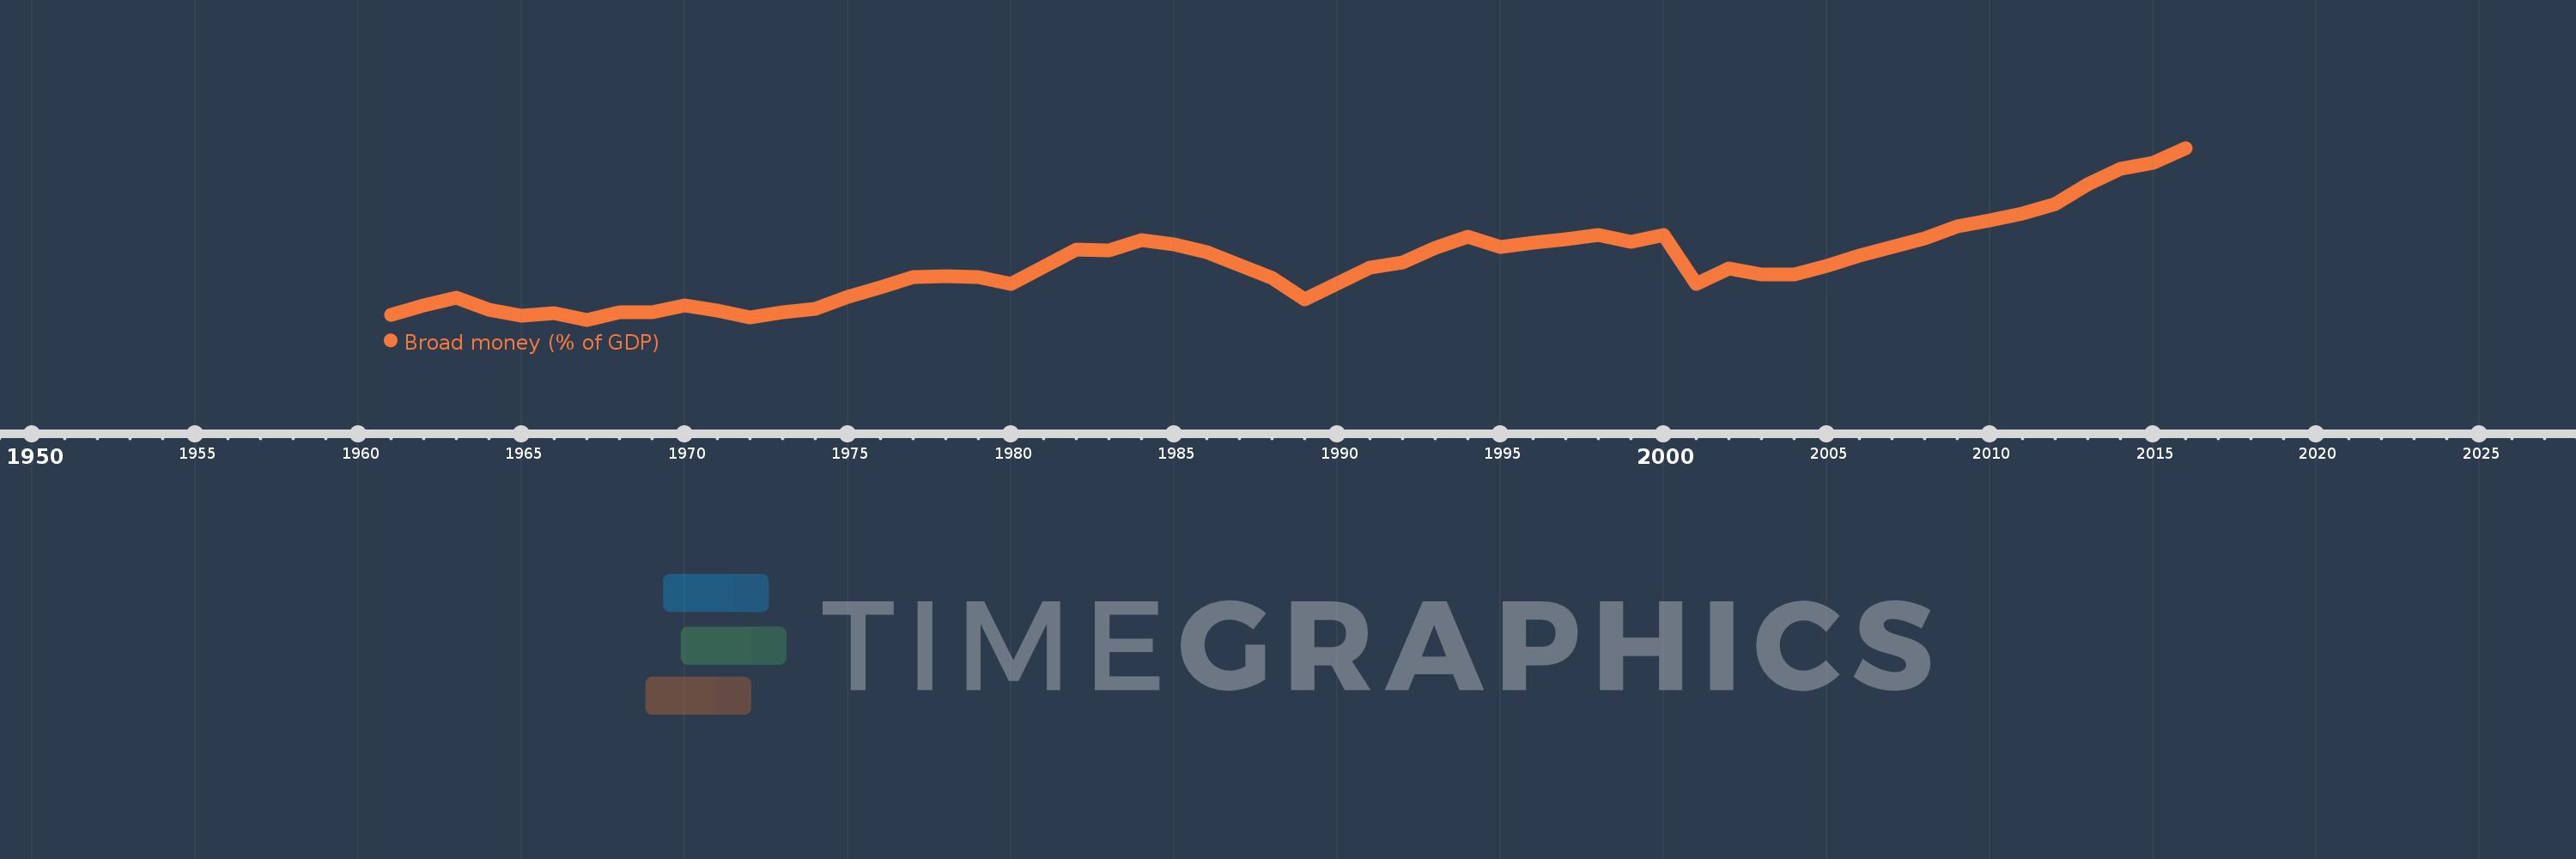
Broad money (% of GDP)
2016,2015,2014,2013,2012,2011,2010,2009,2008,2007,2006,2005,2004,2003,2002,2001,2000,1999,1998,1997,1996,1995,1994,1993,1992,1991,1989,1988,1986,1985,1984,1983,1982,1981,1980,1979,1978,1977,1976,1975,1974,1973,1972,1971,1970,1969,1968,1967,1966,1965,1964,1963,1962,1961
This statistics in other country:
AfghanistanAlbaniaAlgeriaAngolaAntigua and BarbudaArab WorldArgentinaArmeniaArubaAustraliaAzerbaijanBahamas, TheBahrainBangladeshBarbadosBelarusBelizeBeninBhutanBoliviaBosnia and HerzegovinaBotswanaBrazilBrunei DarussalamBulgariaBurkina FasoBurundiCabo VerdeCambodiaCameroonCanadaCaribbean small statesCentral African RepublicCentral Europe and the BalticsChadChileChinaColombiaComorosCongo, Dem. Rep.Congo, Rep.Costa RicaCote d'IvoireCroatiaCzech RepublicDenmarkDjiboutiDominicaDominican RepublicEarly-demographic dividendEast Asia & PacificEast Asia & Pacific (excluding high income)East Asia & Pacific (IDA & IBRD countries)EcuadorEgypt, Arab Rep.El SalvadorEquatorial GuineaEritreaEstoniaEthiopiaEurope & Central Asia (excluding high income)Europe & Central Asia (IDA & IBRD countries)FijiFragile and conflict affected situationsGabonGambia, TheGeorgiaGhanaGrenadaGuatemalaGuineaGuinea-BissauGuyanaHaitiHeavily indebted poor countries (HIPC)High incomeHondurasHong Kong SAR, ChinaHungaryIBRD onlyIcelandIDA & IBRD totalIDA blendIDA onlyIDA totalIndiaIndonesiaIran, Islamic Rep.IraqIsraelJamaicaJapanJordanKazakhstanKenyaKorea, Rep.KuwaitKyrgyz RepublicLao PDRLate-demographic dividendLatin America & Caribbean Latin America & Caribbean (excluding high income)Latin America & the Caribbean (IDA & IBRD countries)LatviaLeast developed countries: UN classificationLebanonLesothoLiberiaLibyaLithuaniaLow & middle incomeLow incomeLower middle incomeMacao SAR, ChinaMacedonia, FYRMadagascarMalawiMalaysiaMaldivesMaliMauritaniaMauritiusMexicoMicronesia, Fed. Sts.Middle East & North AfricaMiddle East & North Africa (excluding high income)Middle East & North Africa (IDA & IBRD countries)Middle incomeMoldovaMongoliaMoroccoMozambiqueMyanmarNamibiaNepalNew ZealandNicaraguaNigerNigeriaNorth AmericaNorwayOECD membersOmanOther small statesPacific island small statesPakistanPanamaPapua New GuineaParaguayPeruPhilippinesPolandPost-demographic dividendPre-demographic dividendQatarRomaniaRussian FederationRwandaSamoaSao Tome and PrincipeSaudi ArabiaSenegalSerbiaSeychellesSierra LeoneSingaporeSlovak RepublicSmall statesSolomon IslandsSouth AfricaSouth AsiaSouth Asia (IDA & IBRD)South SudanSri LankaSt. Kitts and NevisSt. LuciaSt. Vincent and the GrenadinesSub-Saharan Africa Sub-Saharan Africa (excluding high income)Sub-Saharan Africa (IDA & IBRD countries)SudanSurinameSwazilandSwedenSwitzerlandSyrian Arab RepublicTajikistanTanzaniaThailandTimor-LesteTogoTongaTrinidad and TobagoTunisiaTurkeyUgandaUkraineUnited Arab EmiratesUnited KingdomUnited StatesUpper middle incomeUruguayVanuatuVenezuela, RBVietnamWest Bank and GazaWorldYemen, Rep.ZambiaZimbabwe Timeline:
This timeline shows a graph from 1961 to 2016 of Colombia. No data until 1960. Number of actual observations by date: 54.
Source name:
World Development Indicators
Source organization:
International Monetary Fund, International Financial Statistics and data files, and World Bank and OECD GDP estimates.
Categories, topics:
Financial Sector
Last updated:
apr 23, 2017
Indicators value changes by year
Minimum:
19.596
jan 1, 1967
Maximum:
49.227
jan 1, 2016
At the date of observation
Value
Absolute change
Change from previous value
jan 1, 1961
20.387
+20.387
0.0%
jan 1, 1962
22.082
+1.695
8.32%
jan 1, 1963
23.445
+1.363
6.17%
jan 1, 1964
21.314
-2.131
-9.09%
jan 1, 1965
20.304
-1.009
-4.74%
jan 1, 1966
20.697
+0.392
1.93%
jan 1, 1967
19.596
-1.101
-5.32%
jan 1, 1968
20.82
+1.224
6.25%
jan 1, 1969
20.854
+0.034
0.16%
jan 1, 1970
22.046
+1.192
5.72%
jan 1, 1971
21.255
-0.791
-3.59%
jan 1, 1972
20.031
-1.224
-5.76%
jan 1, 1973
20.907
+0.876
4.37%
jan 1, 1974
21.44
+0.534
2.55%
jan 1, 1975
23.482
+2.042
9.52%
jan 1, 1976
25.19
+1.707
7.27%
jan 1, 1977
26.962
+1.772
7.03%
jan 1, 1978
27.097
+0.135
0.5%
jan 1, 1979
27.022
-0.075
-0.28%
jan 1, 1980
25.82
-1.201
-4.45%
jan 1, 1981
28.796
+2.976
11.52%
jan 1, 1982
31.718
+2.922
10.15%
jan 1, 1983
31.613
-0.105
-0.33%
jan 1, 1984
33.375
+1.761
5.57%
jan 1, 1985
32.621
-0.753
-2.26%
jan 1, 1986
31.27
-1.352
-4.14%
jan 1, 1988
26.778
-4.492
-14.37%
jan 1, 1989
23.101
-3.676
-13.73%
jan 1, 1991
28.65
+5.548
24.02%
jan 1, 1992
29.489
+0.839
2.93%
jan 1, 1993
31.936
+2.448
8.3%
jan 1, 1994
33.894
+1.958
6.13%
jan 1, 1995
32.108
-1.786
-5.27%
jan 1, 1996
32.93
+0.821
2.56%
jan 1, 1997
33.415
+0.485
1.47%
jan 1, 1998
34.253
+0.839
2.51%
jan 1, 1999
33.046
-1.207
-3.53%
jan 1, 2000
34.274
+1.228
3.72%
jan 1, 2001
25.82
-8.454
-24.67%
jan 1, 2002
28.509
+2.689
10.41%
jan 1, 2003
27.457
-1.052
-3.69%
jan 1, 2004
27.346
-0.111
-0.4%
jan 1, 2005
28.855
+1.509
5.52%
jan 1, 2006
30.71
+1.855
6.43%
jan 1, 2007
32.097
+1.387
4.51%
jan 1, 2008
33.554
+1.457
4.54%
jan 1, 2009
35.697
+2.143
6.39%
jan 1, 2010
36.695
+0.998
2.8%
jan 1, 2011
37.877
+1.181
3.22%
jan 1, 2012
39.597
+1.72
4.54%
jan 1, 2013
42.892
+3.295
8.32%
jan 1, 2014
45.607
+2.715
6.33%
jan 1, 2015
46.709
+1.101
2.41%
jan 1, 2016
49.227
+2.518
5.39%
Ranking of countries by current statistics by years


Comments: