29
/
en
AIzaSyAYiBZKx7MnpbEhh9jyipgxe19OcubqV5w
April 1, 2024
42145
Latin America & Caribbean (excluding high income)
LAC
false
2
1
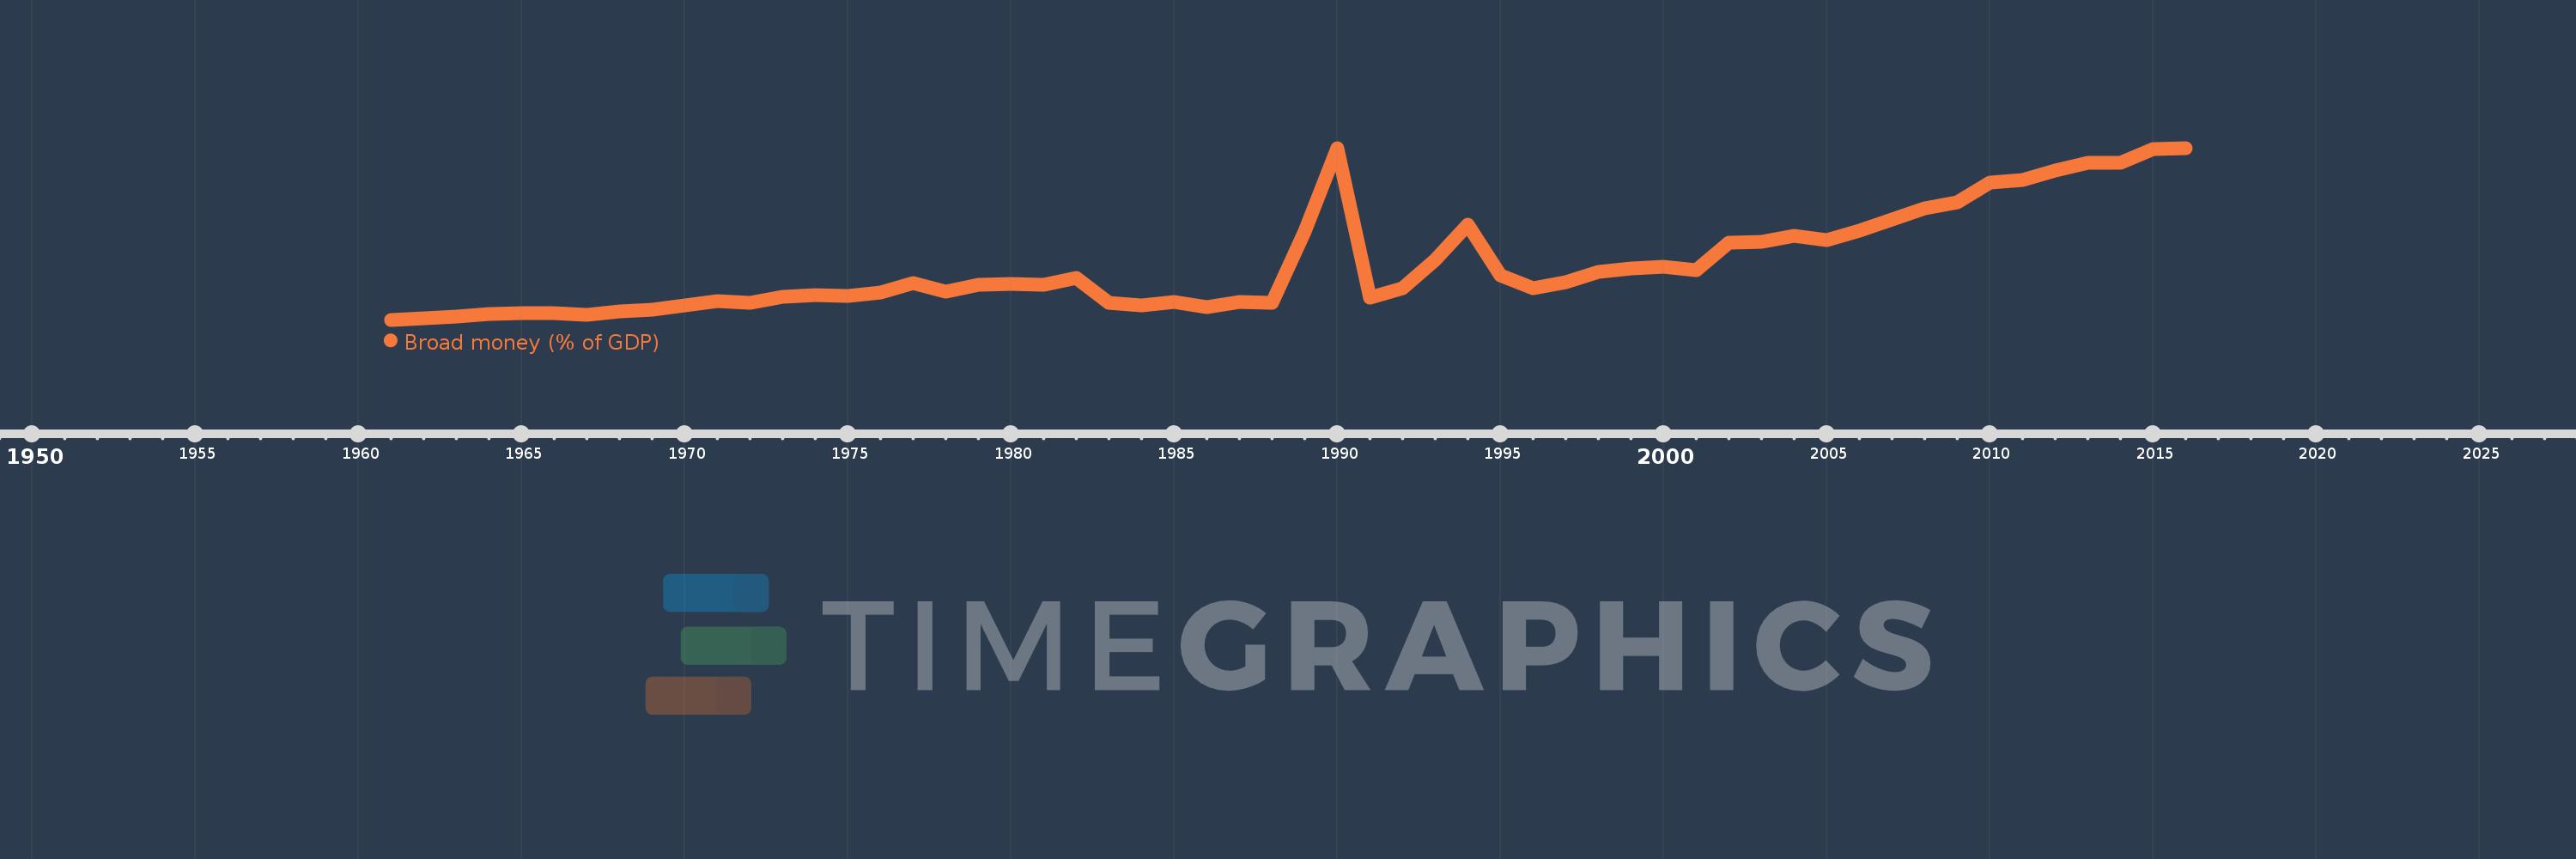
Broad money (% of GDP)
2016,2015,2014,2013,2012,2011,2010,2009,2008,2007,2006,2005,2004,2003,2002,2001,2000,1999,1998,1997,1996,1995,1994,1993,1992,1991,1990,1989,1988,1987,1986,1985,1984,1983,1982,1981,1980,1979,1978,1977,1976,1975,1974,1973,1972,1971,1970,1969,1968,1967,1966,1965,1964,1963,1962,1961
This statistics in other country:
AfghanistanAlbaniaAlgeriaAngolaAntigua and BarbudaArab WorldArgentinaArmeniaArubaAustraliaAzerbaijanBahamas, TheBahrainBangladeshBarbadosBelarusBelizeBeninBhutanBoliviaBosnia and HerzegovinaBotswanaBrazilBrunei DarussalamBulgariaBurkina FasoBurundiCabo VerdeCambodiaCameroonCanadaCaribbean small statesCentral African RepublicCentral Europe and the BalticsChadChileChinaColombiaComorosCongo, Dem. Rep.Congo, Rep.Costa RicaCote d'IvoireCroatiaCzech RepublicDenmarkDjiboutiDominicaDominican RepublicEarly-demographic dividendEast Asia & PacificEast Asia & Pacific (excluding high income)East Asia & Pacific (IDA & IBRD countries)EcuadorEgypt, Arab Rep.El SalvadorEquatorial GuineaEritreaEstoniaEthiopiaEurope & Central Asia (excluding high income)Europe & Central Asia (IDA & IBRD countries)FijiFragile and conflict affected situationsGabonGambia, TheGeorgiaGhanaGrenadaGuatemalaGuineaGuinea-BissauGuyanaHaitiHeavily indebted poor countries (HIPC)High incomeHondurasHong Kong SAR, ChinaHungaryIBRD onlyIcelandIDA & IBRD totalIDA blendIDA onlyIDA totalIndiaIndonesiaIran, Islamic Rep.IraqIsraelJamaicaJapanJordanKazakhstanKenyaKorea, Rep.KuwaitKyrgyz RepublicLao PDRLate-demographic dividendLatin America & Caribbean Latin America & Caribbean (excluding high income)Latin America & the Caribbean (IDA & IBRD countries)LatviaLeast developed countries: UN classificationLebanonLesothoLiberiaLibyaLithuaniaLow & middle incomeLow incomeLower middle incomeMacao SAR, ChinaMacedonia, FYRMadagascarMalawiMalaysiaMaldivesMaliMauritaniaMauritiusMexicoMicronesia, Fed. Sts.Middle East & North AfricaMiddle East & North Africa (excluding high income)Middle East & North Africa (IDA & IBRD countries)Middle incomeMoldovaMongoliaMoroccoMozambiqueMyanmarNamibiaNepalNew ZealandNicaraguaNigerNigeriaNorth AmericaNorwayOECD membersOmanOther small statesPacific island small statesPakistanPanamaPapua New GuineaParaguayPeruPhilippinesPolandPost-demographic dividendPre-demographic dividendQatarRomaniaRussian FederationRwandaSamoaSao Tome and PrincipeSaudi ArabiaSenegalSerbiaSeychellesSierra LeoneSingaporeSlovak RepublicSmall statesSolomon IslandsSouth AfricaSouth AsiaSouth Asia (IDA & IBRD)South SudanSri LankaSt. Kitts and NevisSt. LuciaSt. Vincent and the GrenadinesSub-Saharan Africa Sub-Saharan Africa (excluding high income)Sub-Saharan Africa (IDA & IBRD countries)SudanSurinameSwazilandSwedenSwitzerlandSyrian Arab RepublicTajikistanTanzaniaThailandTimor-LesteTogoTongaTrinidad and TobagoTunisiaTurkeyUgandaUkraineUnited Arab EmiratesUnited KingdomUnited StatesUpper middle incomeUruguayVanuatuVenezuela, RBVietnamWest Bank and GazaWorldYemen, Rep.ZambiaZimbabwe Timeline:
This timeline shows a graph from 1961 to 2016 of Latin America & Caribbean (excluding high income). No data until 1960. Number of actual observations by date: 56.
Source name:
World Development Indicators
Source organization:
International Monetary Fund, International Financial Statistics and data files, and World Bank and OECD GDP estimates.
Categories, topics:
Financial Sector
Last updated:
apr 23, 2017
Indicators value changes by year
Minimum:
19.724
jan 1, 1961
Maximum:
65.651
jan 1, 2016
At the date of observation
Value
Absolute change
Change from previous value
jan 1, 1961
19.724
+19.724
0.0%
jan 1, 1962
20.185
+0.461
2.34%
jan 1, 1963
20.588
+0.403
1.99%
jan 1, 1964
21.338
+0.75
3.64%
jan 1, 1965
21.598
+0.26
1.22%
jan 1, 1966
21.466
-0.132
-0.61%
jan 1, 1967
21.062
-0.404
-1.88%
jan 1, 1968
21.877
+0.815
3.87%
jan 1, 1969
22.336
+0.459
2.1%
jan 1, 1970
23.592
+1.256
5.62%
jan 1, 1971
24.771
+1.179
5.0%
jan 1, 1972
24.33
-0.441
-1.78%
jan 1, 1973
25.926
+1.595
6.56%
jan 1, 1974
26.257
+0.331
1.28%
jan 1, 1975
26.094
-0.164
-0.62%
jan 1, 1976
27.008
+0.914
3.5%
jan 1, 1977
29.591
+2.583
9.56%
jan 1, 1978
27.316
-2.275
-7.69%
jan 1, 1979
29.049
+1.734
6.35%
jan 1, 1980
29.303
+0.254
0.88%
jan 1, 1981
29.067
-0.237
-0.81%
jan 1, 1982
30.967
+1.901
6.54%
jan 1, 1983
24.191
-6.776
-21.88%
jan 1, 1984
23.601
-0.59
-2.44%
jan 1, 1985
24.529
+0.929
3.94%
jan 1, 1986
23.02
-1.51
-6.15%
jan 1, 1987
24.535
+1.515
6.58%
jan 1, 1988
24.202
-0.333
-1.36%
jan 1, 1989
43.267
+19.065
78.78%
jan 1, 1990
65.608
+22.341
51.63%
jan 1, 1991
25.547
-40.061
-61.06%
jan 1, 1992
28.196
+2.649
10.37%
jan 1, 1993
35.832
+7.636
27.08%
jan 1, 1994
45.09
+9.258
25.84%
jan 1, 1995
31.485
-13.605
-30.17%
jan 1, 1996
28.188
-3.297
-10.47%
jan 1, 1997
29.804
+1.616
5.73%
jan 1, 1998
32.406
+2.602
8.73%
jan 1, 1999
33.357
+0.951
2.93%
jan 1, 2000
34.007
+0.65
1.95%
jan 1, 2001
32.941
-1.065
-3.13%
jan 1, 2002
40.262
+7.321
22.22%
jan 1, 2003
40.506
+0.244
0.61%
jan 1, 2004
42.084
+1.578
3.9%
jan 1, 2005
40.996
-1.088
-2.59%
jan 1, 2006
43.474
+2.478
6.04%
jan 1, 2007
46.445
+2.971
6.83%
jan 1, 2008
49.552
+3.107
6.69%
jan 1, 2009
51.072
+1.52
3.07%
jan 1, 2010
56.41
+5.338
10.45%
jan 1, 2011
57.132
+0.722
1.28%
jan 1, 2012
59.511
+2.379
4.16%
jan 1, 2013
61.578
+2.066
3.47%
jan 1, 2014
61.685
+0.107
0.17%
jan 1, 2015
65.344
+3.659
5.93%
jan 1, 2016
65.651
+0.307
0.47%
Ranking of countries by current statistics by years


Comments: