29
/
en
AIzaSyAYiBZKx7MnpbEhh9jyipgxe19OcubqV5w
April 1, 2024
184877
Madagascar
MDG
true
2
1
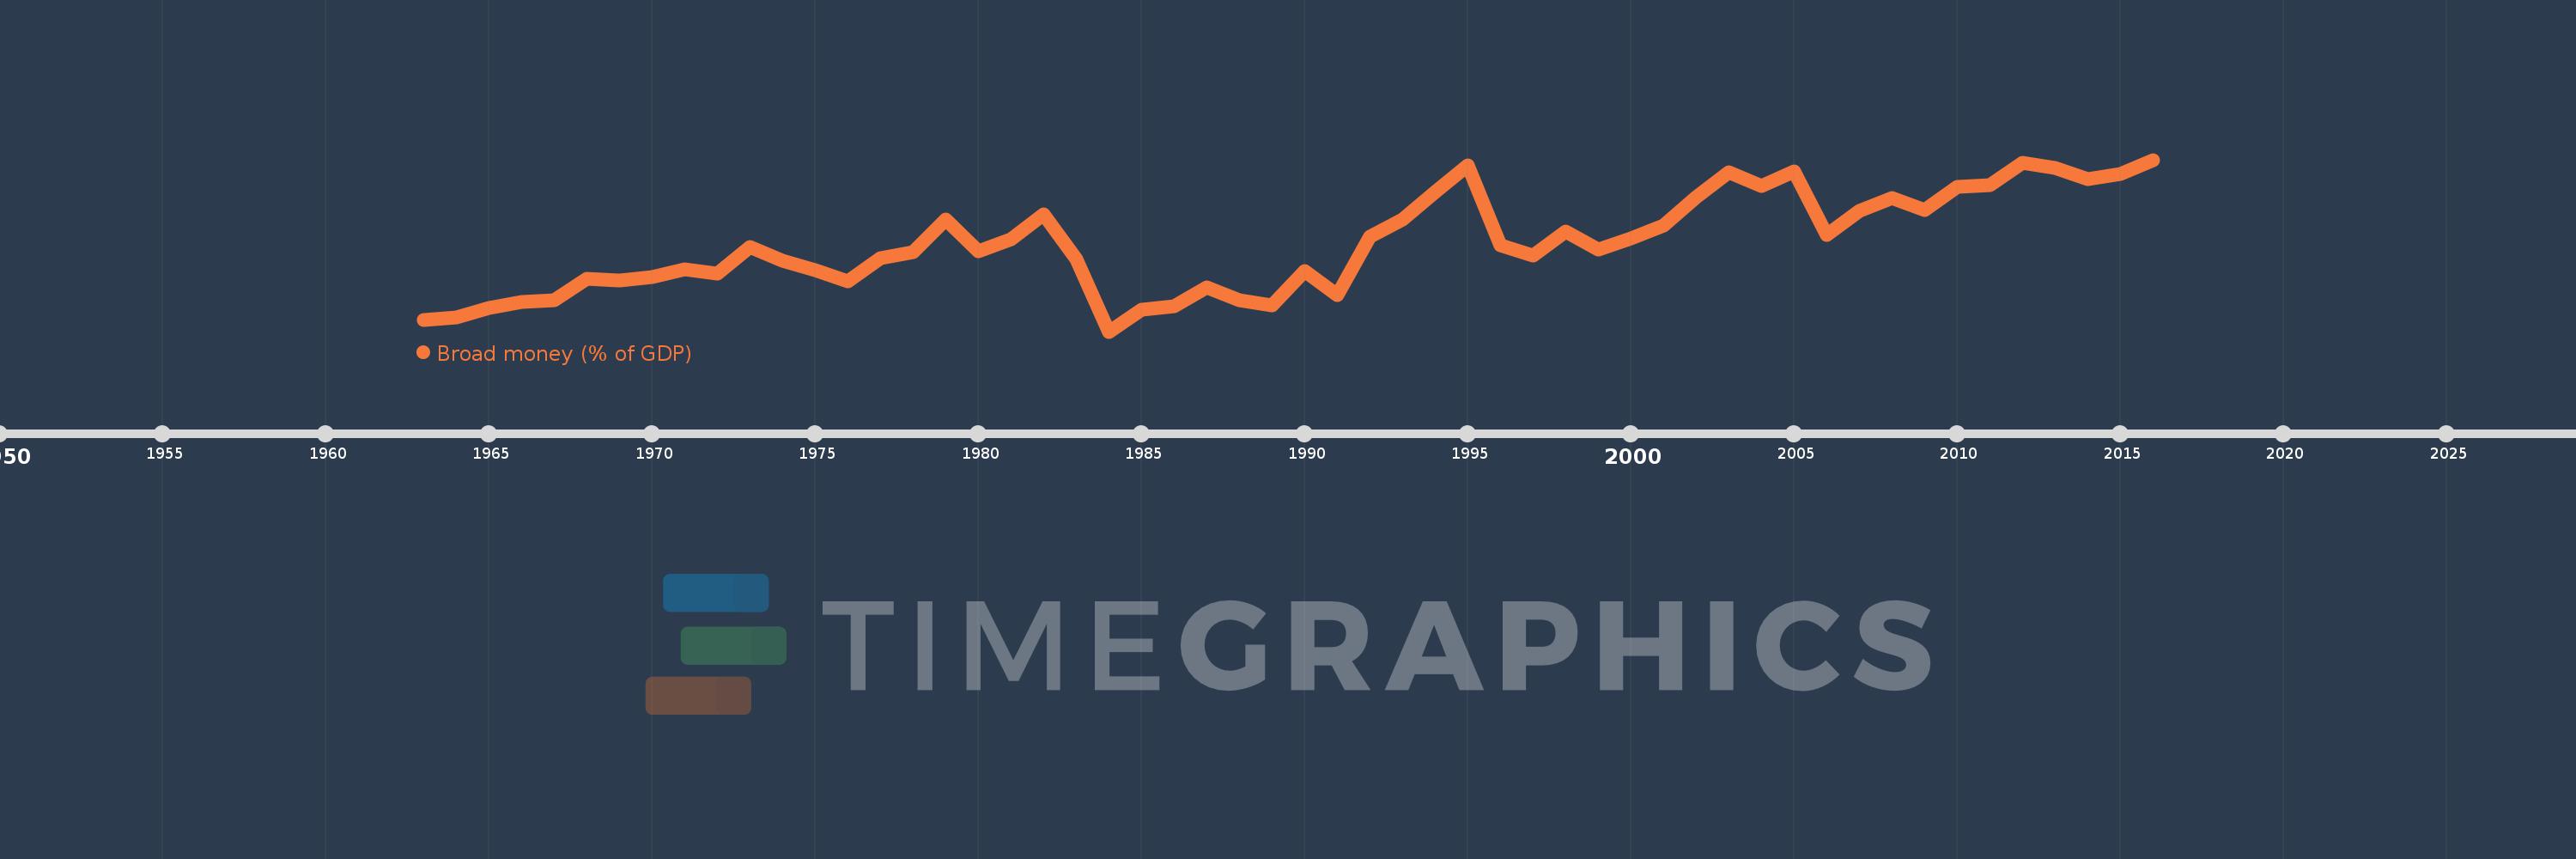
Broad money (% of GDP)
2016,2015,2014,2013,2012,2011,2010,2009,2008,2007,2006,2005,2004,2003,2002,2001,2000,1999,1998,1997,1996,1995,1994,1993,1992,1991,1990,1989,1988,1987,1986,1985,1984,1983,1982,1981,1980,1979,1978,1977,1976,1975,1974,1973,1972,1971,1970,1969,1968,1967,1966,1965,1964,1963
This statistics in other country:
AfghanistanAlbaniaAlgeriaAngolaAntigua and BarbudaArab WorldArgentinaArmeniaArubaAustraliaAzerbaijanBahamas, TheBahrainBangladeshBarbadosBelarusBelizeBeninBhutanBoliviaBosnia and HerzegovinaBotswanaBrazilBrunei DarussalamBulgariaBurkina FasoBurundiCabo VerdeCambodiaCameroonCanadaCaribbean small statesCentral African RepublicCentral Europe and the BalticsChadChileChinaColombiaComorosCongo, Dem. Rep.Congo, Rep.Costa RicaCote d'IvoireCroatiaCzech RepublicDenmarkDjiboutiDominicaDominican RepublicEarly-demographic dividendEast Asia & PacificEast Asia & Pacific (excluding high income)East Asia & Pacific (IDA & IBRD countries)EcuadorEgypt, Arab Rep.El SalvadorEquatorial GuineaEritreaEstoniaEthiopiaEurope & Central Asia (excluding high income)Europe & Central Asia (IDA & IBRD countries)FijiFragile and conflict affected situationsGabonGambia, TheGeorgiaGhanaGrenadaGuatemalaGuineaGuinea-BissauGuyanaHaitiHeavily indebted poor countries (HIPC)High incomeHondurasHong Kong SAR, ChinaHungaryIBRD onlyIcelandIDA & IBRD totalIDA blendIDA onlyIDA totalIndiaIndonesiaIran, Islamic Rep.IraqIsraelJamaicaJapanJordanKazakhstanKenyaKorea, Rep.KuwaitKyrgyz RepublicLao PDRLate-demographic dividendLatin America & Caribbean Latin America & Caribbean (excluding high income)Latin America & the Caribbean (IDA & IBRD countries)LatviaLeast developed countries: UN classificationLebanonLesothoLiberiaLibyaLithuaniaLow & middle incomeLow incomeLower middle incomeMacao SAR, ChinaMacedonia, FYRMadagascarMalawiMalaysiaMaldivesMaliMauritaniaMauritiusMexicoMicronesia, Fed. Sts.Middle East & North AfricaMiddle East & North Africa (excluding high income)Middle East & North Africa (IDA & IBRD countries)Middle incomeMoldovaMongoliaMoroccoMozambiqueMyanmarNamibiaNepalNew ZealandNicaraguaNigerNigeriaNorth AmericaNorwayOECD membersOmanOther small statesPacific island small statesPakistanPanamaPapua New GuineaParaguayPeruPhilippinesPolandPost-demographic dividendPre-demographic dividendQatarRomaniaRussian FederationRwandaSamoaSao Tome and PrincipeSaudi ArabiaSenegalSerbiaSeychellesSierra LeoneSingaporeSlovak RepublicSmall statesSolomon IslandsSouth AfricaSouth AsiaSouth Asia (IDA & IBRD)South SudanSri LankaSt. Kitts and NevisSt. LuciaSt. Vincent and the GrenadinesSub-Saharan Africa Sub-Saharan Africa (excluding high income)Sub-Saharan Africa (IDA & IBRD countries)SudanSurinameSwazilandSwedenSwitzerlandSyrian Arab RepublicTajikistanTanzaniaThailandTimor-LesteTogoTongaTrinidad and TobagoTunisiaTurkeyUgandaUkraineUnited Arab EmiratesUnited KingdomUnited StatesUpper middle incomeUruguayVanuatuVenezuela, RBVietnamWest Bank and GazaWorldYemen, Rep.ZambiaZimbabwe Timeline:
This timeline shows a graph from 1963 to 2016 of Madagascar. No data until 1962. Number of actual observations by date: 54.
Source name:
World Development Indicators
Source organization:
International Monetary Fund, International Financial Statistics and data files, and World Bank and OECD GDP estimates.
Categories, topics:
Financial Sector
Last updated:
apr 23, 2017
Indicators value changes by year
Minimum:
13.767
jan 1, 1984
Maximum:
25.117
jan 1, 2016
At the date of observation
Value
Absolute change
Change from previous value
jan 1, 1963
14.543
+14.543
0.0%
jan 1, 1964
14.719
+0.176
1.21%
jan 1, 1965
15.311
+0.592
4.02%
jan 1, 1966
15.751
+0.44
2.87%
jan 1, 1967
15.826
+0.075
0.48%
jan 1, 1968
17.233
+1.407
8.89%
jan 1, 1969
17.139
-0.093
-0.54%
jan 1, 1970
17.389
+0.249
1.46%
jan 1, 1971
17.865
+0.476
2.74%
jan 1, 1972
17.614
-0.251
-1.41%
jan 1, 1973
19.355
+1.741
9.88%
jan 1, 1974
18.461
-0.893
-4.62%
jan 1, 1975
17.805
-0.657
-3.56%
jan 1, 1976
17.109
-0.695
-3.91%
jan 1, 1977
18.621
+1.511
8.83%
jan 1, 1978
19.034
+0.413
2.22%
jan 1, 1979
21.184
+2.15
11.29%
jan 1, 1980
19.091
-2.093
-9.88%
jan 1, 1981
19.862
+0.772
4.04%
jan 1, 1982
21.52
+1.658
8.35%
jan 1, 1983
18.562
-2.958
-13.75%
jan 1, 1984
13.767
-4.795
-25.83%
jan 1, 1985
15.226
+1.459
10.6%
jan 1, 1986
15.441
+0.214
1.41%
jan 1, 1987
16.665
+1.224
7.93%
jan 1, 1988
15.857
-0.808
-4.85%
jan 1, 1989
15.497
-0.361
-2.27%
jan 1, 1990
17.776
+2.279
14.71%
jan 1, 1991
16.157
-1.619
-9.11%
jan 1, 1992
20.029
+3.872
23.96%
jan 1, 1993
21.152
+1.122
5.6%
jan 1, 1994
22.961
+1.809
8.55%
jan 1, 1995
24.745
+1.784
7.77%
jan 1, 1996
19.483
-5.263
-21.27%
jan 1, 1997
18.768
-0.715
-3.67%
jan 1, 1998
20.381
+1.613
8.59%
jan 1, 1999
19.204
-1.177
-5.77%
jan 1, 2000
19.932
+0.728
3.79%
jan 1, 2001
20.786
+0.854
4.29%
jan 1, 2002
22.633
+1.847
8.89%
jan 1, 2003
24.273
+1.639
7.24%
jan 1, 2004
23.411
-0.862
-3.55%
jan 1, 2005
24.366
+0.956
4.08%
jan 1, 2006
20.13
-4.237
-17.39%
jan 1, 2007
21.741
+1.611
8.0%
jan 1, 2008
22.577
+0.836
3.84%
jan 1, 2009
21.791
-0.786
-3.48%
jan 1, 2010
23.321
+1.53
7.02%
jan 1, 2011
23.46
+0.139
0.6%
jan 1, 2012
24.939
+1.479
6.3%
jan 1, 2013
24.574
-0.366
-1.47%
jan 1, 2014
23.839
-0.735
-2.99%
jan 1, 2015
24.171
+0.332
1.39%
jan 1, 2016
25.117
+0.946
3.91%
Ranking of countries by current statistics by years


Comments: