29
/
en
AIzaSyAYiBZKx7MnpbEhh9jyipgxe19OcubqV5w
April 1, 2024
195232
Mexico
MEX
true
2
1
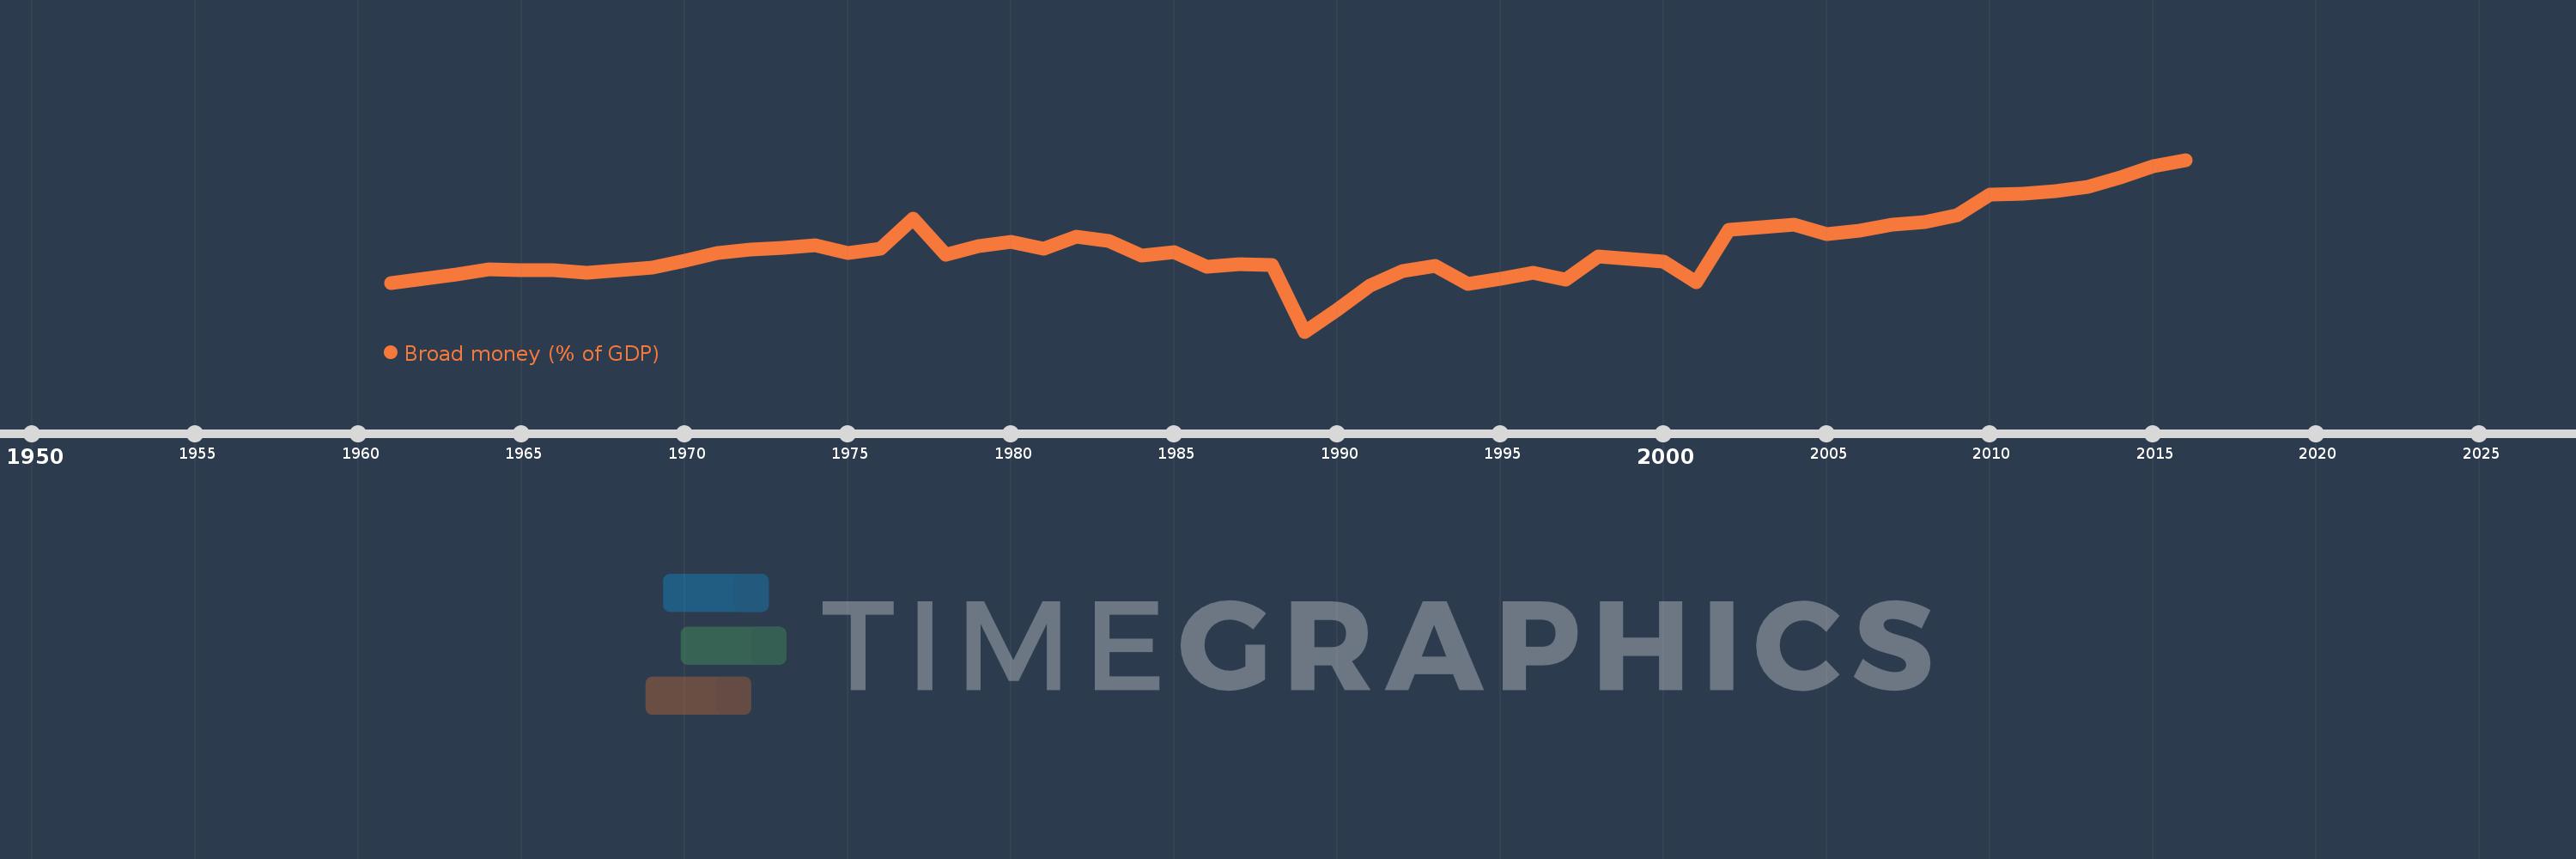
Broad money (% of GDP)
2016,2015,2014,2013,2012,2011,2010,2009,2008,2007,2006,2005,2004,2003,2002,2001,2000,1999,1998,1997,1996,1995,1994,1993,1992,1991,1990,1989,1988,1987,1986,1985,1984,1983,1982,1981,1980,1979,1978,1977,1976,1975,1974,1973,1972,1971,1970,1969,1968,1967,1966,1965,1964,1963,1962,1961
This statistics in other country:
AfghanistanAlbaniaAlgeriaAngolaAntigua and BarbudaArab WorldArgentinaArmeniaArubaAustraliaAzerbaijanBahamas, TheBahrainBangladeshBarbadosBelarusBelizeBeninBhutanBoliviaBosnia and HerzegovinaBotswanaBrazilBrunei DarussalamBulgariaBurkina FasoBurundiCabo VerdeCambodiaCameroonCanadaCaribbean small statesCentral African RepublicCentral Europe and the BalticsChadChileChinaColombiaComorosCongo, Dem. Rep.Congo, Rep.Costa RicaCote d'IvoireCroatiaCzech RepublicDenmarkDjiboutiDominicaDominican RepublicEarly-demographic dividendEast Asia & PacificEast Asia & Pacific (excluding high income)East Asia & Pacific (IDA & IBRD countries)EcuadorEgypt, Arab Rep.El SalvadorEquatorial GuineaEritreaEstoniaEthiopiaEurope & Central Asia (excluding high income)Europe & Central Asia (IDA & IBRD countries)FijiFragile and conflict affected situationsGabonGambia, TheGeorgiaGhanaGrenadaGuatemalaGuineaGuinea-BissauGuyanaHaitiHeavily indebted poor countries (HIPC)High incomeHondurasHong Kong SAR, ChinaHungaryIBRD onlyIcelandIDA & IBRD totalIDA blendIDA onlyIDA totalIndiaIndonesiaIran, Islamic Rep.IraqIsraelJamaicaJapanJordanKazakhstanKenyaKorea, Rep.KuwaitKyrgyz RepublicLao PDRLate-demographic dividendLatin America & Caribbean Latin America & Caribbean (excluding high income)Latin America & the Caribbean (IDA & IBRD countries)LatviaLeast developed countries: UN classificationLebanonLesothoLiberiaLibyaLithuaniaLow & middle incomeLow incomeLower middle incomeMacao SAR, ChinaMacedonia, FYRMadagascarMalawiMalaysiaMaldivesMaliMauritaniaMauritiusMexicoMicronesia, Fed. Sts.Middle East & North AfricaMiddle East & North Africa (excluding high income)Middle East & North Africa (IDA & IBRD countries)Middle incomeMoldovaMongoliaMoroccoMozambiqueMyanmarNamibiaNepalNew ZealandNicaraguaNigerNigeriaNorth AmericaNorwayOECD membersOmanOther small statesPacific island small statesPakistanPanamaPapua New GuineaParaguayPeruPhilippinesPolandPost-demographic dividendPre-demographic dividendQatarRomaniaRussian FederationRwandaSamoaSao Tome and PrincipeSaudi ArabiaSenegalSerbiaSeychellesSierra LeoneSingaporeSlovak RepublicSmall statesSolomon IslandsSouth AfricaSouth AsiaSouth Asia (IDA & IBRD)South SudanSri LankaSt. Kitts and NevisSt. LuciaSt. Vincent and the GrenadinesSub-Saharan Africa Sub-Saharan Africa (excluding high income)Sub-Saharan Africa (IDA & IBRD countries)SudanSurinameSwazilandSwedenSwitzerlandSyrian Arab RepublicTajikistanTanzaniaThailandTimor-LesteTogoTongaTrinidad and TobagoTunisiaTurkeyUgandaUkraineUnited Arab EmiratesUnited KingdomUnited StatesUpper middle incomeUruguayVanuatuVenezuela, RBVietnamWest Bank and GazaWorldYemen, Rep.ZambiaZimbabwe Timeline:
This timeline shows a graph from 1961 to 2016 of Mexico. No data until 1960. Number of actual observations by date: 56.
Source name:
World Development Indicators
Source organization:
International Monetary Fund, International Financial Statistics and data files, and World Bank and OECD GDP estimates.
Categories, topics:
Financial Sector
Last updated:
apr 23, 2017
Indicators value changes by year
Minimum:
11.037
jan 1, 1989
Maximum:
53.227
jan 1, 2016
At the date of observation
Value
Absolute change
Change from previous value
jan 1, 1961
22.91
+22.91
0.0%
jan 1, 1962
23.914
+1.004
4.38%
jan 1, 1963
25.17
+1.256
5.25%
jan 1, 1964
26.395
+1.225
4.87%
jan 1, 1965
26.021
-0.375
-1.42%
jan 1, 1966
26.111
+0.09
0.35%
jan 1, 1967
25.538
-0.573
-2.2%
jan 1, 1968
26.196
+0.659
2.58%
jan 1, 1969
26.659
+0.462
1.77%
jan 1, 1970
28.496
+1.837
6.89%
jan 1, 1971
30.441
+1.945
6.83%
jan 1, 1972
31.179
+0.738
2.42%
jan 1, 1973
31.644
+0.465
1.49%
jan 1, 1974
32.335
+0.691
2.18%
jan 1, 1975
30.282
-2.053
-6.35%
jan 1, 1976
31.299
+1.017
3.36%
jan 1, 1977
38.733
+7.434
23.75%
jan 1, 1978
29.974
-8.759
-22.61%
jan 1, 1979
32.019
+2.044
6.82%
jan 1, 1980
33.138
+1.119
3.49%
jan 1, 1981
31.428
-1.709
-5.16%
jan 1, 1982
34.447
+3.019
9.61%
jan 1, 1983
33.252
-1.195
-3.47%
jan 1, 1984
29.795
-3.457
-10.4%
jan 1, 1985
30.566
+0.771
2.59%
jan 1, 1986
26.984
-3.582
-11.72%
jan 1, 1987
27.617
+0.633
2.34%
jan 1, 1988
27.323
-0.294
-1.06%
jan 1, 1989
11.037
-16.286
-59.61%
jan 1, 1990
16.4
+5.363
48.59%
jan 1, 1991
22.389
+5.989
36.52%
jan 1, 1992
26.006
+3.617
16.16%
jan 1, 1993
27.105
+1.099
4.23%
jan 1, 1994
22.709
-4.396
-16.22%
jan 1, 1995
24.063
+1.354
5.96%
jan 1, 1996
25.587
+1.524
6.33%
jan 1, 1997
23.749
-1.838
-7.18%
jan 1, 1998
29.563
+5.814
24.48%
jan 1, 1999
28.808
-0.755
-2.55%
jan 1, 2000
28.321
-0.487
-1.69%
jan 1, 2001
23.182
-5.139
-18.15%
jan 1, 2002
35.974
+12.792
55.18%
jan 1, 2003
36.761
+0.787
2.19%
jan 1, 2004
37.37
+0.609
1.66%
jan 1, 2005
34.987
-2.383
-6.38%
jan 1, 2006
35.824
+0.837
2.39%
jan 1, 2007
37.323
+1.499
4.19%
jan 1, 2008
37.847
+0.523
1.4%
jan 1, 2009
39.541
+1.695
4.48%
jan 1, 2010
44.769
+5.228
13.22%
jan 1, 2011
44.876
+0.107
0.24%
jan 1, 2012
45.559
+0.683
1.52%
jan 1, 2013
46.62
+1.061
2.33%
jan 1, 2014
48.987
+2.367
5.08%
jan 1, 2015
51.638
+2.651
5.41%
jan 1, 2016
53.227
+1.589
3.08%
Ranking of countries by current statistics by years


Comments: