29
/
en
AIzaSyAYiBZKx7MnpbEhh9jyipgxe19OcubqV5w
April 1, 2024
109373
Congo, Dem. Rep.
COD
true
2
1
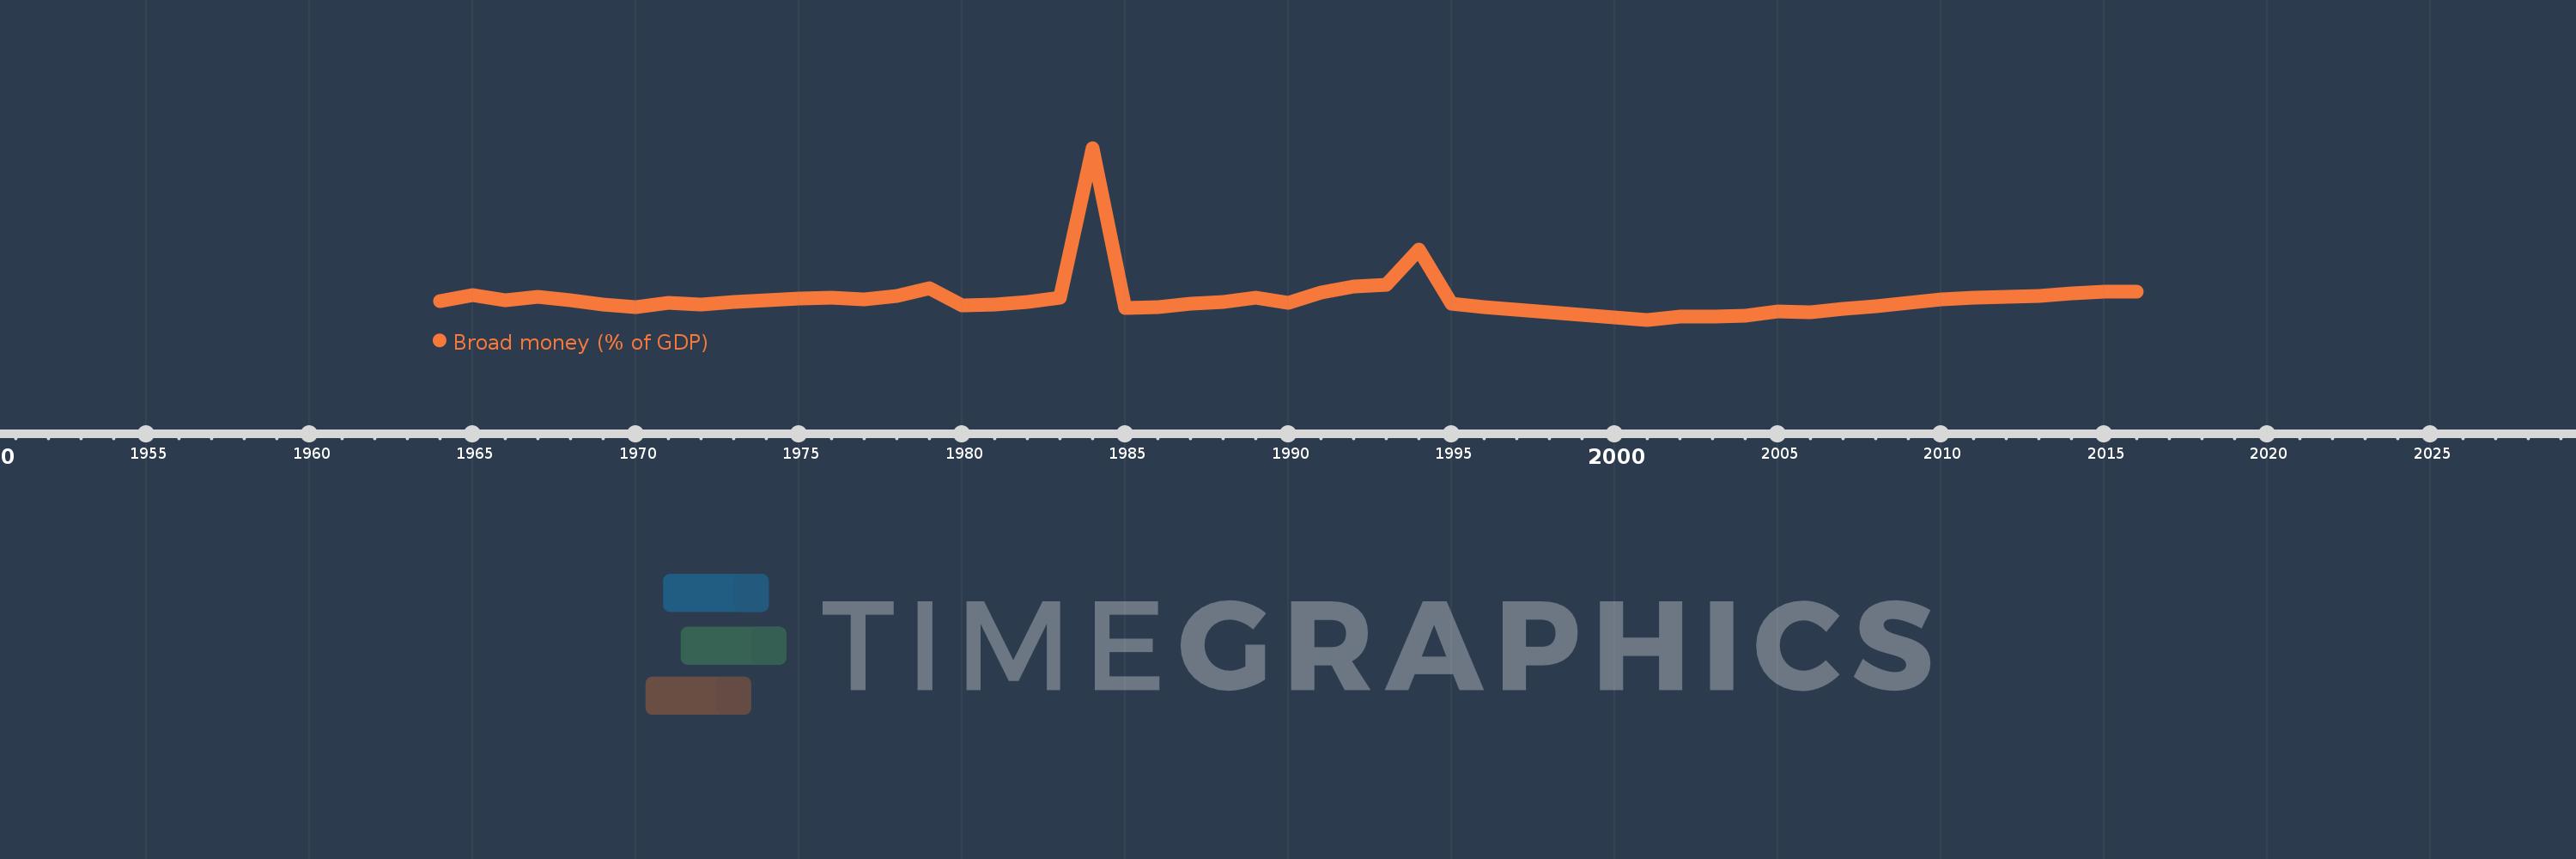
Broad money (% of GDP)
2016,2015,2014,2013,2012,2011,2010,2009,2008,2007,2006,2005,2004,2003,2002,2001,1996,1995,1994,1993,1992,1991,1990,1989,1988,1987,1986,1985,1984,1983,1982,1981,1980,1979,1978,1977,1976,1975,1974,1973,1972,1971,1970,1969,1968,1967,1966,1965,1964
This statistics in other country:
AfghanistanAlbaniaAlgeriaAngolaAntigua and BarbudaArab WorldArgentinaArmeniaArubaAustraliaAzerbaijanBahamas, TheBahrainBangladeshBarbadosBelarusBelizeBeninBhutanBoliviaBosnia and HerzegovinaBotswanaBrazilBrunei DarussalamBulgariaBurkina FasoBurundiCabo VerdeCambodiaCameroonCanadaCaribbean small statesCentral African RepublicCentral Europe and the BalticsChadChileChinaColombiaComorosCongo, Dem. Rep.Congo, Rep.Costa RicaCote d'IvoireCroatiaCzech RepublicDenmarkDjiboutiDominicaDominican RepublicEarly-demographic dividendEast Asia & PacificEast Asia & Pacific (excluding high income)East Asia & Pacific (IDA & IBRD countries)EcuadorEgypt, Arab Rep.El SalvadorEquatorial GuineaEritreaEstoniaEthiopiaEurope & Central Asia (excluding high income)Europe & Central Asia (IDA & IBRD countries)FijiFragile and conflict affected situationsGabonGambia, TheGeorgiaGhanaGrenadaGuatemalaGuineaGuinea-BissauGuyanaHaitiHeavily indebted poor countries (HIPC)High incomeHondurasHong Kong SAR, ChinaHungaryIBRD onlyIcelandIDA & IBRD totalIDA blendIDA onlyIDA totalIndiaIndonesiaIran, Islamic Rep.IraqIsraelJamaicaJapanJordanKazakhstanKenyaKorea, Rep.KuwaitKyrgyz RepublicLao PDRLate-demographic dividendLatin America & Caribbean Latin America & Caribbean (excluding high income)Latin America & the Caribbean (IDA & IBRD countries)LatviaLeast developed countries: UN classificationLebanonLesothoLiberiaLibyaLithuaniaLow & middle incomeLow incomeLower middle incomeMacao SAR, ChinaMacedonia, FYRMadagascarMalawiMalaysiaMaldivesMaliMauritaniaMauritiusMexicoMicronesia, Fed. Sts.Middle East & North AfricaMiddle East & North Africa (excluding high income)Middle East & North Africa (IDA & IBRD countries)Middle incomeMoldovaMongoliaMoroccoMozambiqueMyanmarNamibiaNepalNew ZealandNicaraguaNigerNigeriaNorth AmericaNorwayOECD membersOmanOther small statesPacific island small statesPakistanPanamaPapua New GuineaParaguayPeruPhilippinesPolandPost-demographic dividendPre-demographic dividendQatarRomaniaRussian FederationRwandaSamoaSao Tome and PrincipeSaudi ArabiaSenegalSerbiaSeychellesSierra LeoneSingaporeSlovak RepublicSmall statesSolomon IslandsSouth AfricaSouth AsiaSouth Asia (IDA & IBRD)South SudanSri LankaSt. Kitts and NevisSt. LuciaSt. Vincent and the GrenadinesSub-Saharan Africa Sub-Saharan Africa (excluding high income)Sub-Saharan Africa (IDA & IBRD countries)SudanSurinameSwazilandSwedenSwitzerlandSyrian Arab RepublicTajikistanTanzaniaThailandTimor-LesteTogoTongaTrinidad and TobagoTunisiaTurkeyUgandaUkraineUnited Arab EmiratesUnited KingdomUnited StatesUpper middle incomeUruguayVanuatuVenezuela, RBVietnamWest Bank and GazaWorldYemen, Rep.ZambiaZimbabwe Timeline:
This timeline shows a graph from 1964 to 2016 of Congo, Dem. Rep.. No data until 1963. Number of actual observations by date: 49.
Source name:
World Development Indicators
Source organization:
International Monetary Fund, International Financial Statistics and data files, and World Bank and OECD GDP estimates.
Categories, topics:
Financial Sector
Last updated:
apr 23, 2017
Indicators value changes by year
Maximum:
72.372
jan 1, 1984
At the date of observation
Value
Absolute change
Change from previous value
jan 1, 1964
9.455
+9.455
0.0%
jan 1, 1965
11.8
+2.345
24.8%
jan 1, 1966
9.794
-2.006
-17.0%
jan 1, 1967
10.946
+1.153
11.77%
jan 1, 1968
9.813
-1.134
-10.36%
jan 1, 1969
7.751
-2.061
-21.01%
jan 1, 1970
6.742
-1.01
-13.02%
jan 1, 1971
8.52
+1.778
26.37%
jan 1, 1972
8.004
-0.516
-6.06%
jan 1, 1973
8.812
+0.808
10.09%
jan 1, 1974
9.527
+0.716
8.12%
jan 1, 1975
10.385
+0.858
9.01%
jan 1, 1976
10.712
+0.326
3.14%
jan 1, 1977
9.922
-0.789
-7.37%
jan 1, 1978
11.423
+1.501
15.13%
jan 1, 1979
14.499
+3.076
26.93%
jan 1, 1980
7.512
-6.987
-48.19%
jan 1, 1981
7.901
+0.389
5.17%
jan 1, 1982
8.807
+0.906
11.46%
jan 1, 1983
10.783
+1.976
22.44%
jan 1, 1984
72.372
+61.589
571.16%
jan 1, 1985
6.618
-65.755
-90.86%
jan 1, 1986
6.897
+0.28
4.22%
jan 1, 1987
8.066
+1.169
16.95%
jan 1, 1988
8.784
+0.718
8.9%
jan 1, 1989
10.565
+1.78
20.27%
jan 1, 1990
8.519
-2.045
-19.36%
jan 1, 1991
12.89
+4.37
51.3%
jan 1, 1992
15.214
+2.324
18.03%
jan 1, 1993
15.843
+0.629
4.14%
jan 1, 1994
30.679
+14.836
93.64%
jan 1, 1995
8.401
-22.278
-72.62%
jan 1, 1996
6.741
-1.661
-19.77%
jan 1, 2001
1.617
-5.123
-76.01%
jan 1, 2002
2.857
+1.24
76.69%
jan 1, 2003
2.917
+0.06
2.09%
jan 1, 2004
3.161
+0.243
8.35%
jan 1, 2005
5.063
+1.902
60.18%
jan 1, 2006
4.53
-0.532
-10.52%
jan 1, 2007
6.006
+1.476
32.57%
jan 1, 2008
7.16
+1.154
19.22%
jan 1, 2009
8.74
+1.579
22.06%
jan 1, 2010
9.917
+1.177
13.46%
jan 1, 2011
10.63
+0.714
7.2%
jan 1, 2012
10.95
+0.32
3.01%
jan 1, 2013
11.471
+0.521
4.76%
jan 1, 2014
12.463
+0.991
8.64%
jan 1, 2015
13.01
+0.547
4.39%
jan 1, 2016
13.225
+0.215
1.66%
Ranking of countries by current statistics by years


Comments: