29
/
en
AIzaSyAYiBZKx7MnpbEhh9jyipgxe19OcubqV5w
April 1, 2024
146599
Guinea-Bissau
GNB
true
2
1
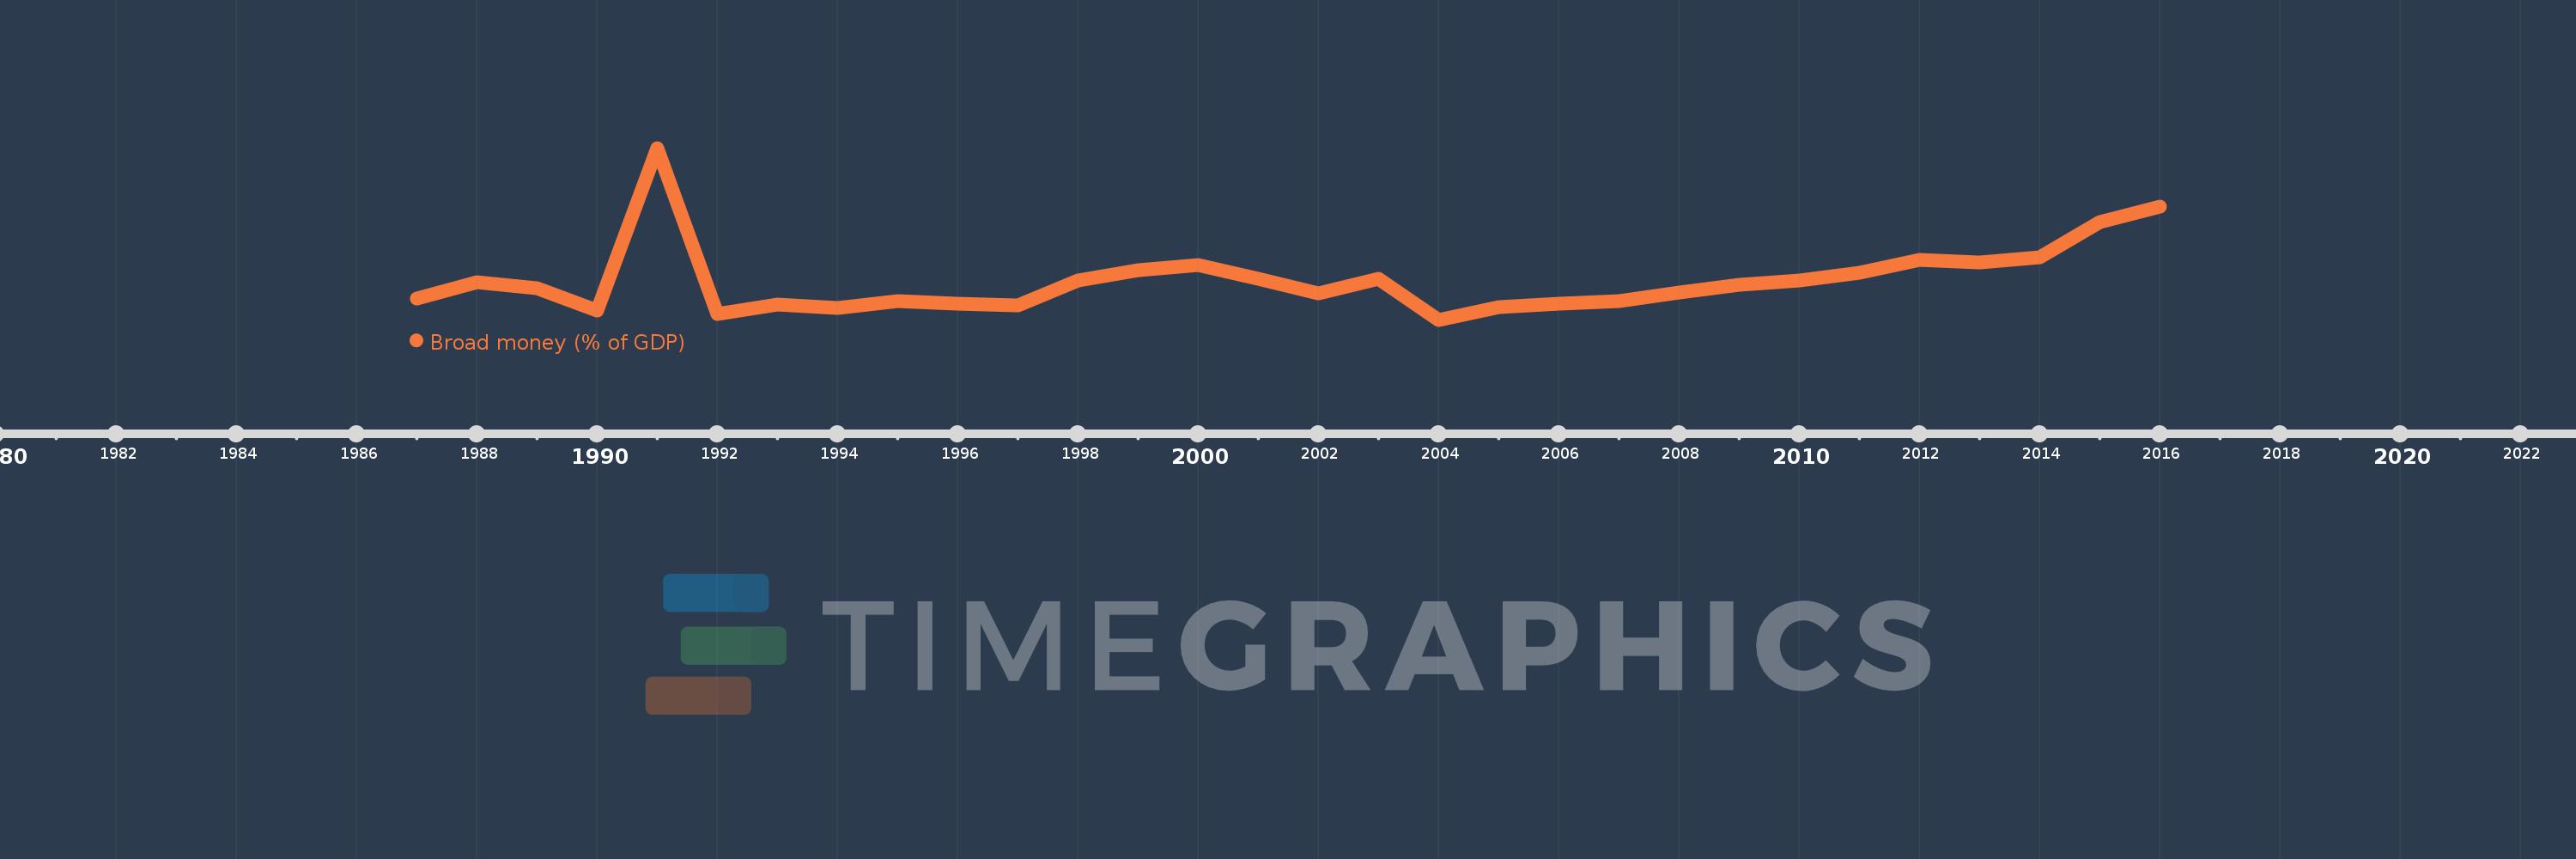
Broad money (% of GDP)
2016,2015,2014,2013,2012,2011,2010,2009,2008,2007,2006,2005,2004,2003,2002,2001,2000,1999,1998,1997,1996,1995,1994,1993,1992,1991,1990,1989,1988,1987
This statistics in other country:
AfghanistanAlbaniaAlgeriaAngolaAntigua and BarbudaArab WorldArgentinaArmeniaArubaAustraliaAzerbaijanBahamas, TheBahrainBangladeshBarbadosBelarusBelizeBeninBhutanBoliviaBosnia and HerzegovinaBotswanaBrazilBrunei DarussalamBulgariaBurkina FasoBurundiCabo VerdeCambodiaCameroonCanadaCaribbean small statesCentral African RepublicCentral Europe and the BalticsChadChileChinaColombiaComorosCongo, Dem. Rep.Congo, Rep.Costa RicaCote d'IvoireCroatiaCzech RepublicDenmarkDjiboutiDominicaDominican RepublicEarly-demographic dividendEast Asia & PacificEast Asia & Pacific (excluding high income)East Asia & Pacific (IDA & IBRD countries)EcuadorEgypt, Arab Rep.El SalvadorEquatorial GuineaEritreaEstoniaEthiopiaEurope & Central Asia (excluding high income)Europe & Central Asia (IDA & IBRD countries)FijiFragile and conflict affected situationsGabonGambia, TheGeorgiaGhanaGrenadaGuatemalaGuineaGuinea-BissauGuyanaHaitiHeavily indebted poor countries (HIPC)High incomeHondurasHong Kong SAR, ChinaHungaryIBRD onlyIcelandIDA & IBRD totalIDA blendIDA onlyIDA totalIndiaIndonesiaIran, Islamic Rep.IraqIsraelJamaicaJapanJordanKazakhstanKenyaKorea, Rep.KuwaitKyrgyz RepublicLao PDRLate-demographic dividendLatin America & Caribbean Latin America & Caribbean (excluding high income)Latin America & the Caribbean (IDA & IBRD countries)LatviaLeast developed countries: UN classificationLebanonLesothoLiberiaLibyaLithuaniaLow & middle incomeLow incomeLower middle incomeMacao SAR, ChinaMacedonia, FYRMadagascarMalawiMalaysiaMaldivesMaliMauritaniaMauritiusMexicoMicronesia, Fed. Sts.Middle East & North AfricaMiddle East & North Africa (excluding high income)Middle East & North Africa (IDA & IBRD countries)Middle incomeMoldovaMongoliaMoroccoMozambiqueMyanmarNamibiaNepalNew ZealandNicaraguaNigerNigeriaNorth AmericaNorwayOECD membersOmanOther small statesPacific island small statesPakistanPanamaPapua New GuineaParaguayPeruPhilippinesPolandPost-demographic dividendPre-demographic dividendQatarRomaniaRussian FederationRwandaSamoaSao Tome and PrincipeSaudi ArabiaSenegalSerbiaSeychellesSierra LeoneSingaporeSlovak RepublicSmall statesSolomon IslandsSouth AfricaSouth AsiaSouth Asia (IDA & IBRD)South SudanSri LankaSt. Kitts and NevisSt. LuciaSt. Vincent and the GrenadinesSub-Saharan Africa Sub-Saharan Africa (excluding high income)Sub-Saharan Africa (IDA & IBRD countries)SudanSurinameSwazilandSwedenSwitzerlandSyrian Arab RepublicTajikistanTanzaniaThailandTimor-LesteTogoTongaTrinidad and TobagoTunisiaTurkeyUgandaUkraineUnited Arab EmiratesUnited KingdomUnited StatesUpper middle incomeUruguayVanuatuVenezuela, RBVietnamWest Bank and GazaWorldYemen, Rep.ZambiaZimbabwe Timeline:
This timeline shows a graph from 1987 to 2016 of Guinea-Bissau. No data until 1986. Number of actual observations by date: 30.
Source name:
World Development Indicators
Source organization:
International Monetary Fund, International Financial Statistics and data files, and World Bank and OECD GDP estimates.
Categories, topics:
Financial Sector
Last updated:
apr 23, 2017
Indicators value changes by year
Minimum:
10.937
jan 1, 2004
Maximum:
68.869
jan 1, 1991
At the date of observation
Value
Absolute change
Change from previous value
jan 1, 1987
17.999
+17.999
0.0%
jan 1, 1988
23.488
+5.489
30.5%
jan 1, 1989
21.674
-1.814
-7.72%
jan 1, 1990
14.108
-7.566
-34.91%
jan 1, 1991
68.869
+54.761
388.17%
jan 1, 1992
12.747
-56.121
-81.49%
jan 1, 1993
16.117
+3.37
26.44%
jan 1, 1994
14.876
-1.242
-7.7%
jan 1, 1995
17.367
+2.492
16.75%
jan 1, 1996
16.436
-0.931
-5.36%
jan 1, 1997
15.687
-0.749
-4.56%
jan 1, 1998
24.088
+8.401
53.56%
jan 1, 1999
27.544
+3.456
14.35%
jan 1, 2000
29.506
+1.962
7.12%
jan 1, 2001
24.867
-4.638
-15.72%
jan 1, 2002
19.74
-5.128
-20.62%
jan 1, 2003
24.623
+4.883
24.74%
jan 1, 2004
10.937
-13.686
-55.58%
jan 1, 2005
15.335
+4.398
40.21%
jan 1, 2006
16.476
+1.14
7.44%
jan 1, 2007
17.191
+0.715
4.34%
jan 1, 2008
20.211
+3.02
17.57%
jan 1, 2009
22.596
+2.384
11.8%
jan 1, 2010
24.044
+1.449
6.41%
jan 1, 2011
26.748
+2.704
11.24%
jan 1, 2012
31.265
+4.517
16.89%
jan 1, 2013
30.354
-0.911
-2.91%
jan 1, 2014
31.936
+1.582
5.21%
jan 1, 2015
43.943
+12.007
37.6%
jan 1, 2016
49.04
+5.097
11.6%
Ranking of countries by current statistics by years


Comments: