29
/
en
AIzaSyAYiBZKx7MnpbEhh9jyipgxe19OcubqV5w
April 1, 2024
99936
Cameroon
CMR
true
2
1
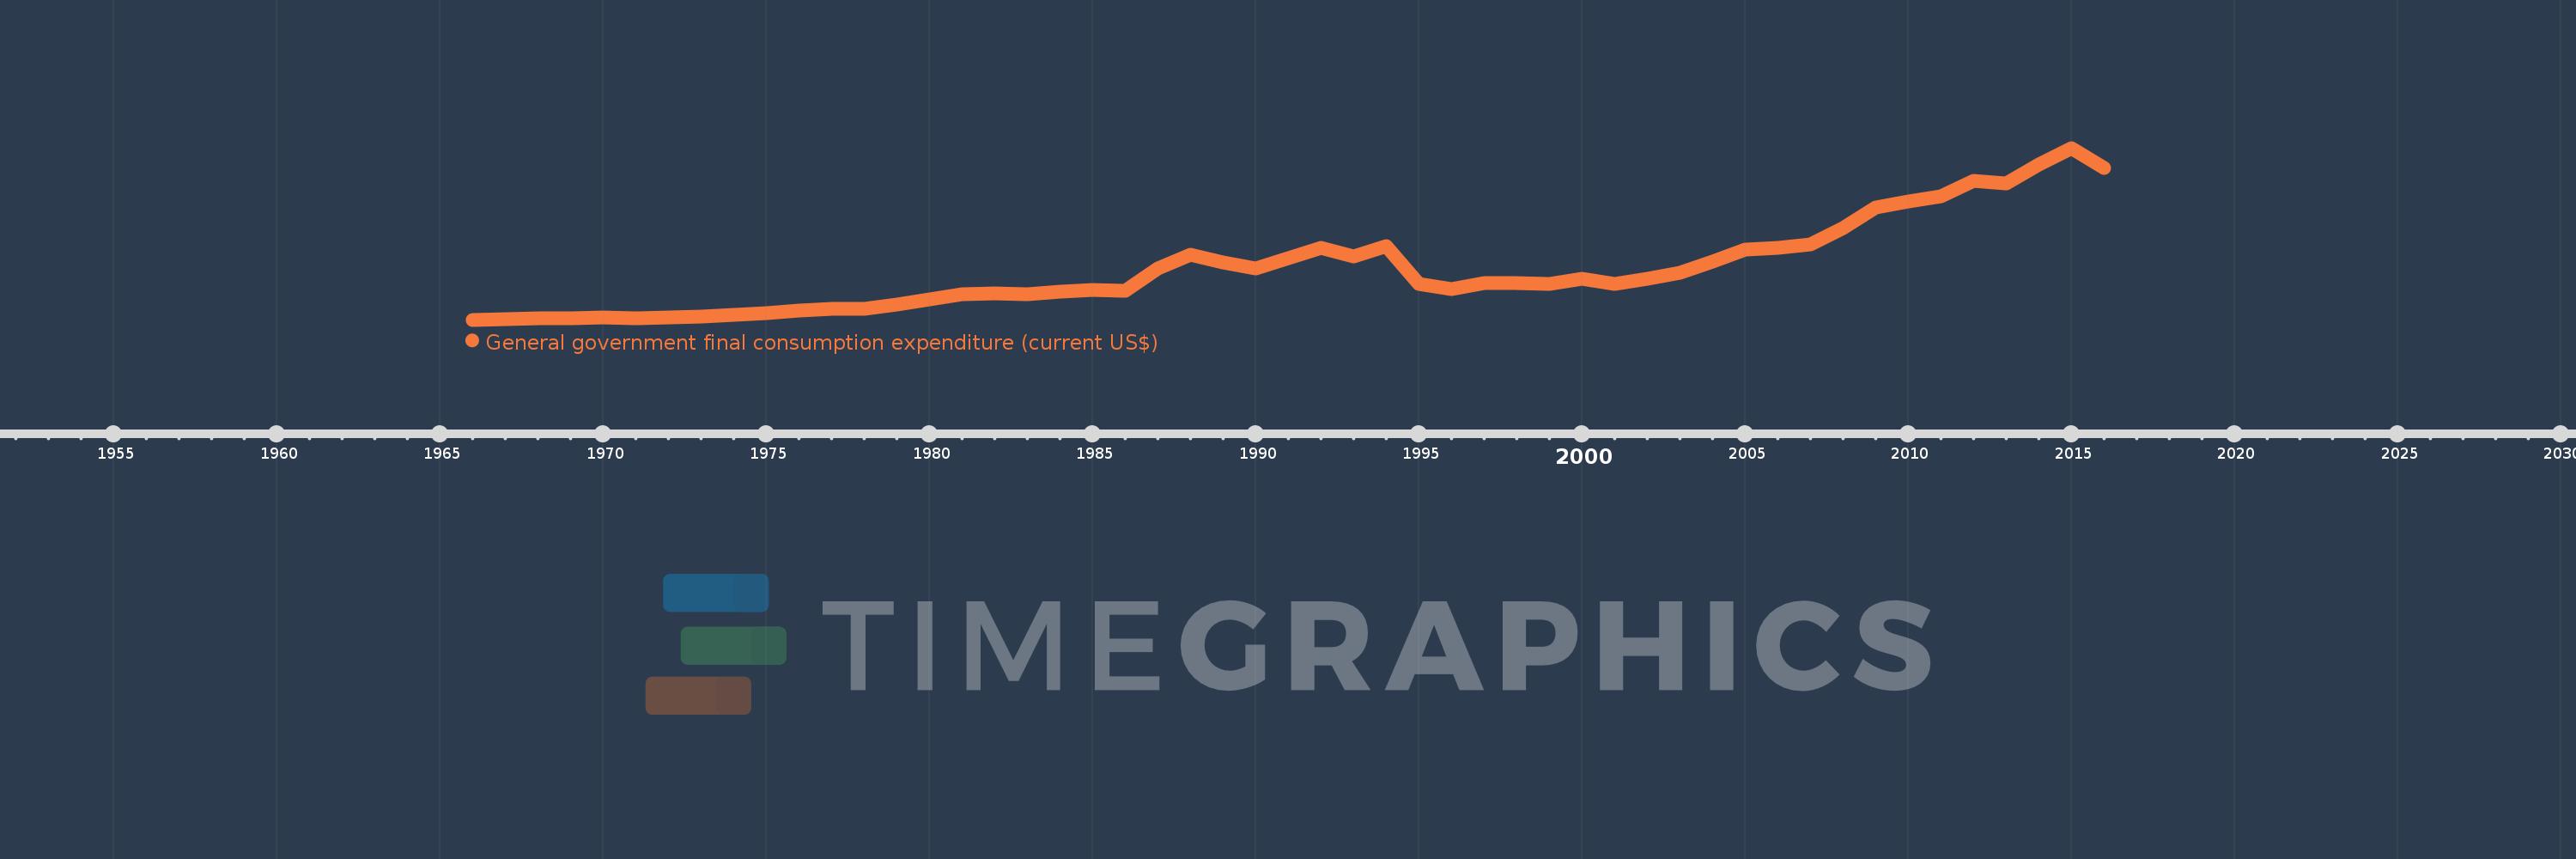
General government final consumption expenditure (current US$)
2016,2015,2014,2013,2012,2011,2010,2009,2008,2007,2006,2005,2004,2003,2002,2001,2000,1999,1998,1997,1996,1995,1994,1993,1992,1991,1990,1989,1988,1987,1986,1985,1984,1983,1982,1981,1980,1979,1978,1977,1976,1975,1974,1973,1972,1971,1970,1969,1968,1967,1966
This statistics in other country:
AfghanistanAlbaniaAlgeriaAngolaAntigua and BarbudaArab WorldArgentinaArmeniaArubaAustraliaAustriaAzerbaijanBahamas, TheBahrainBangladeshBarbadosBelarusBelgiumBelizeBeninBermudaBhutanBoliviaBosnia and HerzegovinaBotswanaBrazilBrunei DarussalamBulgariaBurkina FasoBurundiCabo VerdeCambodiaCameroonCanadaCaribbean small statesCentral African RepublicCentral Europe and the BalticsChadChileChinaColombiaComorosCongo, Dem. Rep.Congo, Rep.Costa RicaCote d'IvoireCroatiaCubaCyprusCzech RepublicDenmarkDjiboutiDominicaDominican RepublicEarly-demographic dividendEast Asia & PacificEast Asia & Pacific (excluding high income)East Asia & Pacific (IDA & IBRD countries)EcuadorEgypt, Arab Rep.El SalvadorEquatorial GuineaEritreaEstoniaEthiopiaEuro areaEurope & Central AsiaEurope & Central Asia (excluding high income)Europe & Central Asia (IDA & IBRD countries)European UnionFaroe IslandsFijiFinlandFragile and conflict affected situationsFranceFrench PolynesiaGabonGambia, TheGeorgiaGermanyGhanaGreeceGrenadaGuatemalaGuineaGuinea-BissauGuyanaHaitiHeavily indebted poor countries (HIPC)High incomeHondurasHong Kong SAR, ChinaHungaryIBRD onlyIcelandIDA & IBRD totalIDA blendIDA onlyIDA totalIndiaIndonesiaIran, Islamic Rep.IraqIrelandIsraelItalyJamaicaJapanJordanKazakhstanKenyaKiribatiKorea, Rep.KosovoKuwaitKyrgyz RepublicLao PDRLate-demographic dividendLatin America & Caribbean Latin America & Caribbean (excluding high income)Latin America & the Caribbean (IDA & IBRD countries)LatviaLeast developed countries: UN classificationLebanonLesothoLiberiaLibyaLithuaniaLow & middle incomeLow incomeLower middle incomeLuxembourgMacao SAR, ChinaMacedonia, FYRMadagascarMalawiMalaysiaMaldivesMaliMaltaMauritaniaMauritiusMexicoMicronesia, Fed. Sts.Middle East & North AfricaMiddle East & North Africa (excluding high income)Middle East & North Africa (IDA & IBRD countries)Middle incomeMoldovaMongoliaMontenegroMoroccoMozambiqueNamibiaNepalNetherlandsNew CaledoniaNew ZealandNicaraguaNigerNigeriaNorth AmericaNorwayOECD membersOmanOther small statesPakistanPanamaPapua New GuineaParaguayPeruPhilippinesPolandPortugalPost-demographic dividendPre-demographic dividendPuerto RicoQatarRomaniaRussian FederationRwandaSaudi ArabiaSenegalSerbiaSeychellesSierra LeoneSingaporeSlovak RepublicSloveniaSmall statesSolomon IslandsSomaliaSouth AfricaSouth AsiaSouth Asia (IDA & IBRD)South SudanSpainSri LankaSt. Kitts and NevisSt. LuciaSt. Vincent and the GrenadinesSub-Saharan Africa Sub-Saharan Africa (excluding high income)Sub-Saharan Africa (IDA & IBRD countries)SudanSurinameSwazilandSwedenSwitzerlandSyrian Arab RepublicTajikistanTanzaniaThailandTimor-LesteTogoTongaTrinidad and TobagoTunisiaTurkeyTurkmenistanUgandaUkraineUnited Arab EmiratesUnited KingdomUnited StatesUpper middle incomeUruguayUzbekistanVanuatuVenezuela, RBVietnamWest Bank and GazaWorldYemen, Rep.ZambiaZimbabwe Timeline:
This timeline shows a graph from 1966 to 2016 of Cameroon. No data until 1965. Number of actual observations by date: 51.
Source name:
World Development Indicators
Source organization:
World Bank national accounts data, and OECD National Accounts data files.
Categories, topics:
Economy & Growth
Last updated:
apr 23, 2017
Indicators value changes by year
Minimum:
106.103 mln
jan 1, 1966
Maximum:
3.785 bln
jan 1, 2015
At the date of observation
Value
Absolute change
Change from previous value
jan 1, 1966
106.103 mln
+106.103 mln
0.0%
jan 1, 1967
126.501 mln
+20.397 mln
19.22%
jan 1, 1968
129.384 mln
+2.883 mln
2.28%
jan 1, 1969
139.462 mln
+10.078 mln
7.79%
jan 1, 1970
156.287 mln
+16.826 mln
12.06%
jan 1, 1971
138.894 mln
-17.393 mln
-11.13%
jan 1, 1972
150.354 mln
+11.46 mln
8.25%
jan 1, 1973
174.321 mln
+23.967 mln
15.94%
jan 1, 1974
203.345 mln
+29.024 mln
16.65%
jan 1, 1975
248.873 mln
+45.528 mln
22.39%
jan 1, 1976
299.869 mln
+50.996 mln
20.49%
jan 1, 1977
330.984 mln
+31.115 mln
10.38%
jan 1, 1978
330.582 mln
-401.34K
-0.12%
jan 1, 1979
430.849 mln
+100.267 mln
30.33%
jan 1, 1980
536.789 mln
+105.939 mln
24.59%
jan 1, 1981
653.904 mln
+117.115 mln
21.82%
jan 1, 1982
676.321 mln
+22.417 mln
3.43%
jan 1, 1983
647.18 mln
-29.14 mln
-4.31%
jan 1, 1984
701.248 mln
+54.068 mln
8.35%
jan 1, 1985
748.197 mln
+46.949 mln
6.7%
jan 1, 1986
732.92 mln
-15.277 mln
-2.04%
jan 1, 1987
1.204 bln
+471.159 mln
64.29%
jan 1, 1988
1.495 bln
+291.265 mln
24.19%
jan 1, 1989
1.34 bln
-155.039 mln
-10.37%
jan 1, 1990
1.2 bln
-140.397 mln
-10.47%
jan 1, 1991
1.422 bln
+221.978 mln
18.5%
jan 1, 1992
1.651 bln
+228.733 mln
16.09%
jan 1, 1993
1.46 bln
-190.459 mln
-11.54%
jan 1, 1994
1.679 bln
+218.362 mln
14.95%
jan 1, 1995
864.938 mln
-813.584 mln
-48.47%
jan 1, 1996
757.71 mln
-107.227 mln
-12.4%
jan 1, 1997
892.918 mln
+135.208 mln
17.84%
jan 1, 1998
895.497 mln
+2.579 mln
0.29%
jan 1, 1999
875.581 mln
-19.916 mln
-2.22%
jan 1, 2000
991.881 mln
+116.3 mln
13.28%
jan 1, 2001
878.295 mln
-113.587 mln
-11.45%
jan 1, 2002
986.088 mln
+107.793 mln
12.27%
jan 1, 2003
1.112 bln
+126.021 mln
12.78%
jan 1, 2004
1.359 bln
+246.603 mln
22.17%
jan 1, 2005
1.603 bln
+244.732 mln
18.01%
jan 1, 2006
1.653 bln
+49.852 mln
3.11%
jan 1, 2007
1.724 bln
+70.352 mln
4.26%
jan 1, 2008
2.073 bln
+349.279 mln
20.26%
jan 1, 2009
2.518 bln
+444.734 mln
21.45%
jan 1, 2010
2.633 bln
+115.482 mln
4.59%
jan 1, 2011
2.743 bln
+109.621 mln
4.16%
jan 1, 2012
3.088 bln
+345.43 mln
12.59%
jan 1, 2013
3.033 bln
-55.681 mln
-1.8%
jan 1, 2014
3.422 bln
+389.477 mln
12.84%
jan 1, 2015
3.785 bln
+363.494 mln
10.62%
jan 1, 2016
3.351 bln
-434.902 mln
-11.49%
Ranking of countries by current statistics by years


Comments: