29
/
en
AIzaSyAYiBZKx7MnpbEhh9jyipgxe19OcubqV5w
April 1, 2024
124816
Egypt, Arab Rep.
EGY
true
2
1
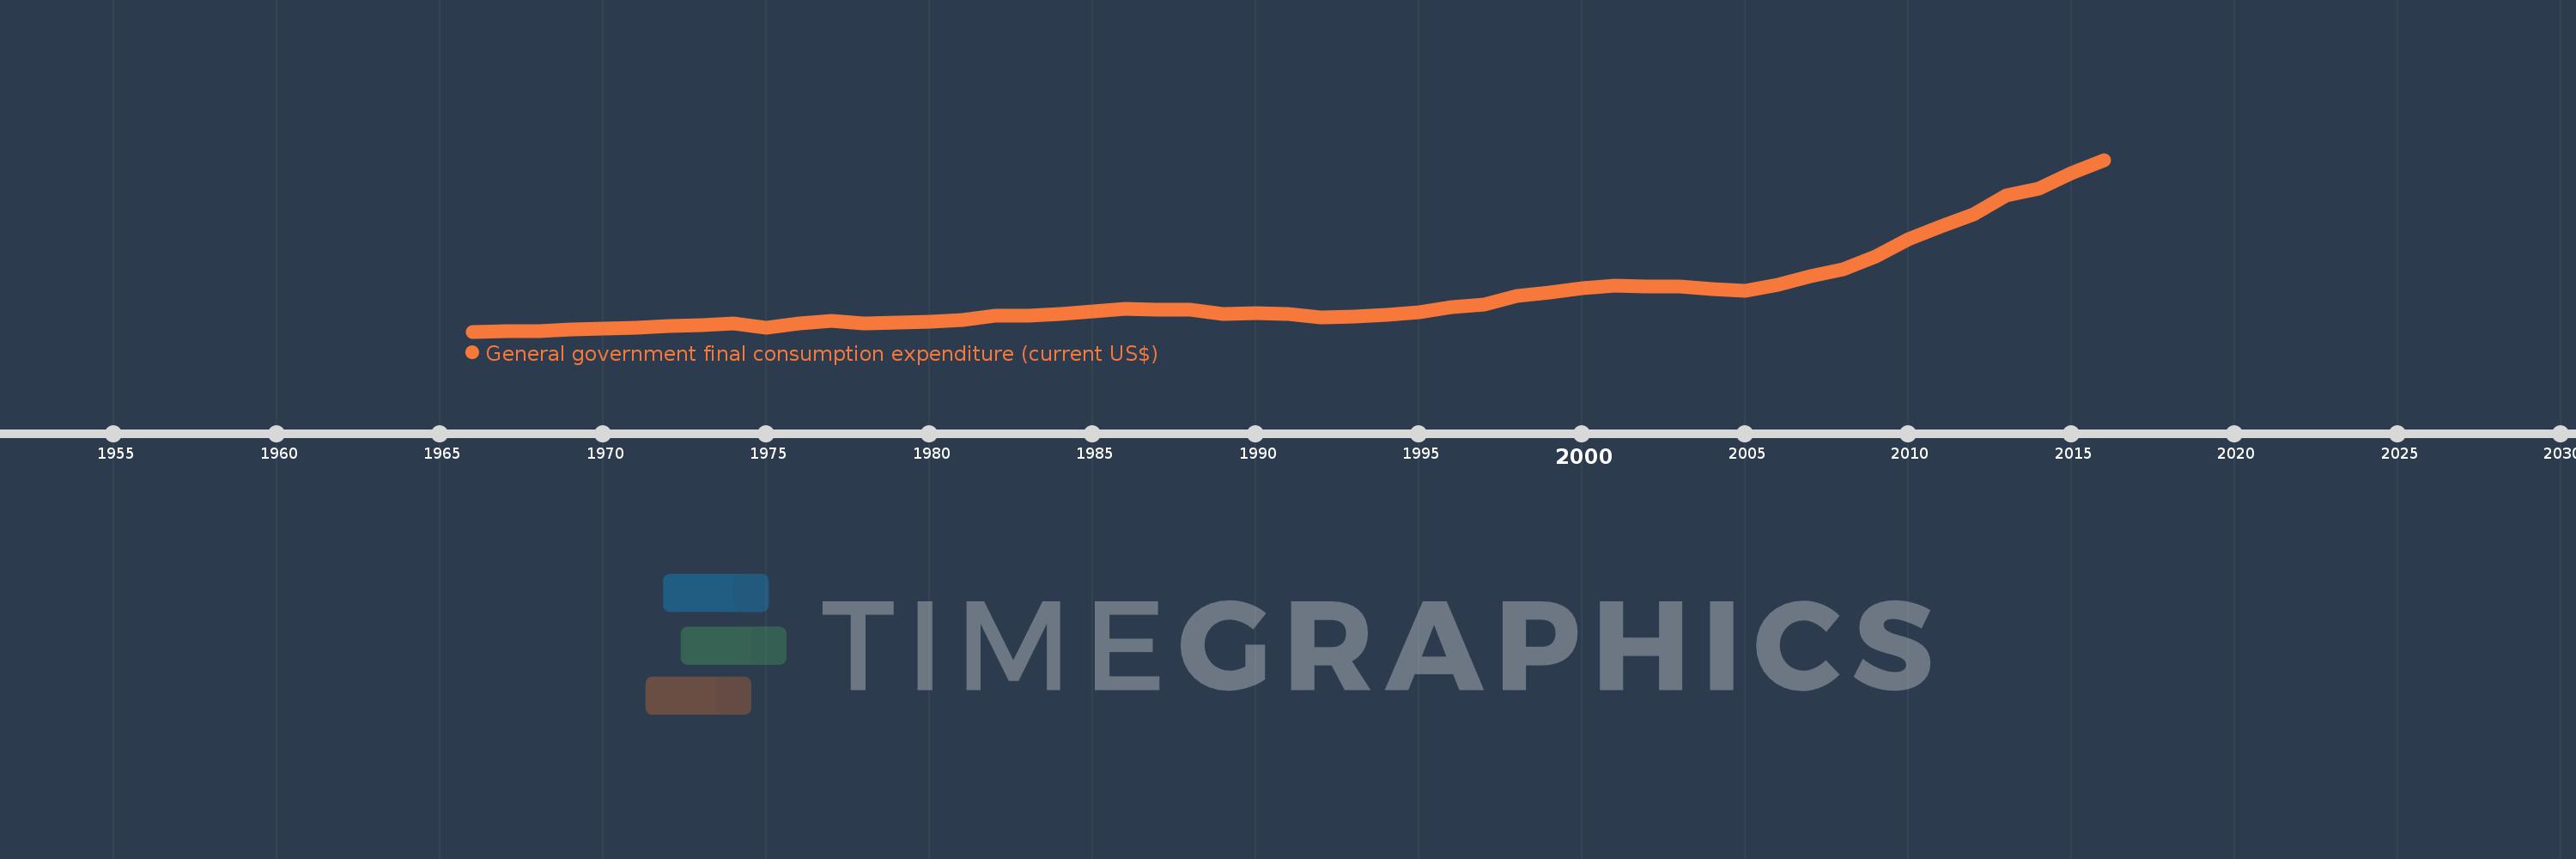
General government final consumption expenditure (current US$)
2016,2015,2014,2013,2012,2011,2010,2009,2008,2007,2006,2005,2004,2003,2002,2001,2000,1999,1998,1997,1996,1995,1994,1993,1992,1991,1990,1989,1988,1987,1986,1985,1984,1983,1982,1981,1980,1979,1978,1977,1976,1975,1974,1973,1972,1971,1970,1969,1968,1967,1966
This statistics in other country:
AfghanistanAlbaniaAlgeriaAngolaAntigua and BarbudaArab WorldArgentinaArmeniaArubaAustraliaAustriaAzerbaijanBahamas, TheBahrainBangladeshBarbadosBelarusBelgiumBelizeBeninBermudaBhutanBoliviaBosnia and HerzegovinaBotswanaBrazilBrunei DarussalamBulgariaBurkina FasoBurundiCabo VerdeCambodiaCameroonCanadaCaribbean small statesCentral African RepublicCentral Europe and the BalticsChadChileChinaColombiaComorosCongo, Dem. Rep.Congo, Rep.Costa RicaCote d'IvoireCroatiaCubaCyprusCzech RepublicDenmarkDjiboutiDominicaDominican RepublicEarly-demographic dividendEast Asia & PacificEast Asia & Pacific (excluding high income)East Asia & Pacific (IDA & IBRD countries)EcuadorEgypt, Arab Rep.El SalvadorEquatorial GuineaEritreaEstoniaEthiopiaEuro areaEurope & Central AsiaEurope & Central Asia (excluding high income)Europe & Central Asia (IDA & IBRD countries)European UnionFaroe IslandsFijiFinlandFragile and conflict affected situationsFranceFrench PolynesiaGabonGambia, TheGeorgiaGermanyGhanaGreeceGrenadaGuatemalaGuineaGuinea-BissauGuyanaHaitiHeavily indebted poor countries (HIPC)High incomeHondurasHong Kong SAR, ChinaHungaryIBRD onlyIcelandIDA & IBRD totalIDA blendIDA onlyIDA totalIndiaIndonesiaIran, Islamic Rep.IraqIrelandIsraelItalyJamaicaJapanJordanKazakhstanKenyaKiribatiKorea, Rep.KosovoKuwaitKyrgyz RepublicLao PDRLate-demographic dividendLatin America & Caribbean Latin America & Caribbean (excluding high income)Latin America & the Caribbean (IDA & IBRD countries)LatviaLeast developed countries: UN classificationLebanonLesothoLiberiaLibyaLithuaniaLow & middle incomeLow incomeLower middle incomeLuxembourgMacao SAR, ChinaMacedonia, FYRMadagascarMalawiMalaysiaMaldivesMaliMaltaMauritaniaMauritiusMexicoMicronesia, Fed. Sts.Middle East & North AfricaMiddle East & North Africa (excluding high income)Middle East & North Africa (IDA & IBRD countries)Middle incomeMoldovaMongoliaMontenegroMoroccoMozambiqueNamibiaNepalNetherlandsNew CaledoniaNew ZealandNicaraguaNigerNigeriaNorth AmericaNorwayOECD membersOmanOther small statesPakistanPanamaPapua New GuineaParaguayPeruPhilippinesPolandPortugalPost-demographic dividendPre-demographic dividendPuerto RicoQatarRomaniaRussian FederationRwandaSaudi ArabiaSenegalSerbiaSeychellesSierra LeoneSingaporeSlovak RepublicSloveniaSmall statesSolomon IslandsSomaliaSouth AfricaSouth AsiaSouth Asia (IDA & IBRD)South SudanSpainSri LankaSt. Kitts and NevisSt. LuciaSt. Vincent and the GrenadinesSub-Saharan Africa Sub-Saharan Africa (excluding high income)Sub-Saharan Africa (IDA & IBRD countries)SudanSurinameSwazilandSwedenSwitzerlandSyrian Arab RepublicTajikistanTanzaniaThailandTimor-LesteTogoTongaTrinidad and TobagoTunisiaTurkeyTurkmenistanUgandaUkraineUnited Arab EmiratesUnited KingdomUnited StatesUpper middle incomeUruguayUzbekistanVanuatuVenezuela, RBVietnamWest Bank and GazaWorldYemen, Rep.ZambiaZimbabwe Timeline:
This timeline shows a graph from 1966 to 2016 of Egypt, Arab Rep.. No data until 1965. Number of actual observations by date: 51.
Source name:
World Development Indicators
Source organization:
World Bank national accounts data, and OECD National Accounts data files.
Categories, topics:
Economy & Growth
Last updated:
apr 23, 2017
Indicators value changes by year
Minimum:
994.758 mln
jan 1, 1966
Maximum:
39.125 bln
jan 1, 2016
At the date of observation
Value
Absolute change
Change from previous value
jan 1, 1966
994.758 mln
+994.758 mln
0.0%
jan 1, 1967
1.03 bln
+35.46 mln
3.56%
jan 1, 1968
1.147 bln
+116.62 mln
11.32%
jan 1, 1969
1.406 bln
+258.77 mln
22.56%
jan 1, 1970
1.643 bln
+237.492 mln
16.9%
jan 1, 1971
1.898 bln
+255.167 mln
15.53%
jan 1, 1972
2.139 bln
+240.728 mln
12.68%
jan 1, 1973
2.35 bln
+211.057 mln
9.87%
jan 1, 1974
2.714 bln
+363.946 mln
15.49%
jan 1, 1975
1.868 bln
-846.139 mln
-31.18%
jan 1, 1976
2.845 bln
+977.385 mln
52.33%
jan 1, 1977
3.317 bln
+471.539 mln
16.57%
jan 1, 1978
2.856 bln
-461.143 mln
-13.9%
jan 1, 1979
3.05 bln
+194.694 mln
6.82%
jan 1, 1980
3.103 bln
+52.524 mln
1.72%
jan 1, 1981
3.59 bln
+487.282 mln
15.7%
jan 1, 1982
4.451 bln
+861.212 mln
23.99%
jan 1, 1983
4.562 bln
+110.225 mln
2.48%
jan 1, 1984
4.843 bln
+281.264 mln
6.17%
jan 1, 1985
5.526 bln
+682.853 mln
14.1%
jan 1, 1986
5.981 bln
+454.833 mln
8.23%
jan 1, 1987
5.931 bln
-49.749 mln
-0.83%
jan 1, 1988
5.774 bln
-157.013 mln
-2.65%
jan 1, 1989
4.884 bln
-890.174 mln
-15.42%
jan 1, 1990
5.008 bln
+124.672 mln
2.55%
jan 1, 1991
4.868 bln
-140.607 mln
-2.81%
jan 1, 1992
4.138 bln
-730.066 mln
-15.0%
jan 1, 1993
4.363 bln
+225.546 mln
5.45%
jan 1, 1994
4.802 bln
+438.788 mln
10.06%
jan 1, 1995
5.338 bln
+536.158 mln
11.17%
jan 1, 1996
6.34 bln
+1.002 bln
18.78%
jan 1, 1997
7.017 bln
+676.197 mln
10.67%
jan 1, 1998
8.879 bln
+1.863 bln
26.55%
jan 1, 1999
9.593 bln
+713.624 mln
8.04%
jan 1, 2000
10.528 bln
+935.188 mln
9.75%
jan 1, 2001
11.185 bln
+656.632 mln
6.24%
jan 1, 2002
11.051 bln
-133.874 mln
-1.2%
jan 1, 2003
11.06 bln
+8.961 mln
0.08%
jan 1, 2004
10.507 bln
-552.506 mln
-5.0%
jan 1, 2005
10.057 bln
-450.38 mln
-4.29%
jan 1, 2006
11.425 bln
+1.368 bln
13.61%
jan 1, 2007
13.207 bln
+1.782 bln
15.6%
jan 1, 2008
14.786 bln
+1.579 bln
11.95%
jan 1, 2009
17.727 bln
+2.942 bln
19.89%
jan 1, 2010
21.451 bln
+3.724 bln
21.01%
jan 1, 2011
24.436 bln
+2.984 bln
13.91%
jan 1, 2012
27.024 bln
+2.588 bln
10.59%
jan 1, 2013
31.229 bln
+4.205 bln
15.56%
jan 1, 2014
32.761 bln
+1.533 bln
4.91%
jan 1, 2015
36.205 bln
+3.443 bln
10.51%
jan 1, 2016
39.125 bln
+2.92 bln
8.07%
Ranking of countries by current statistics by years


Comments: