29
/
en
AIzaSyAYiBZKx7MnpbEhh9jyipgxe19OcubqV5w
April 1, 2024
167507
Kenya
KEN
true
2
1
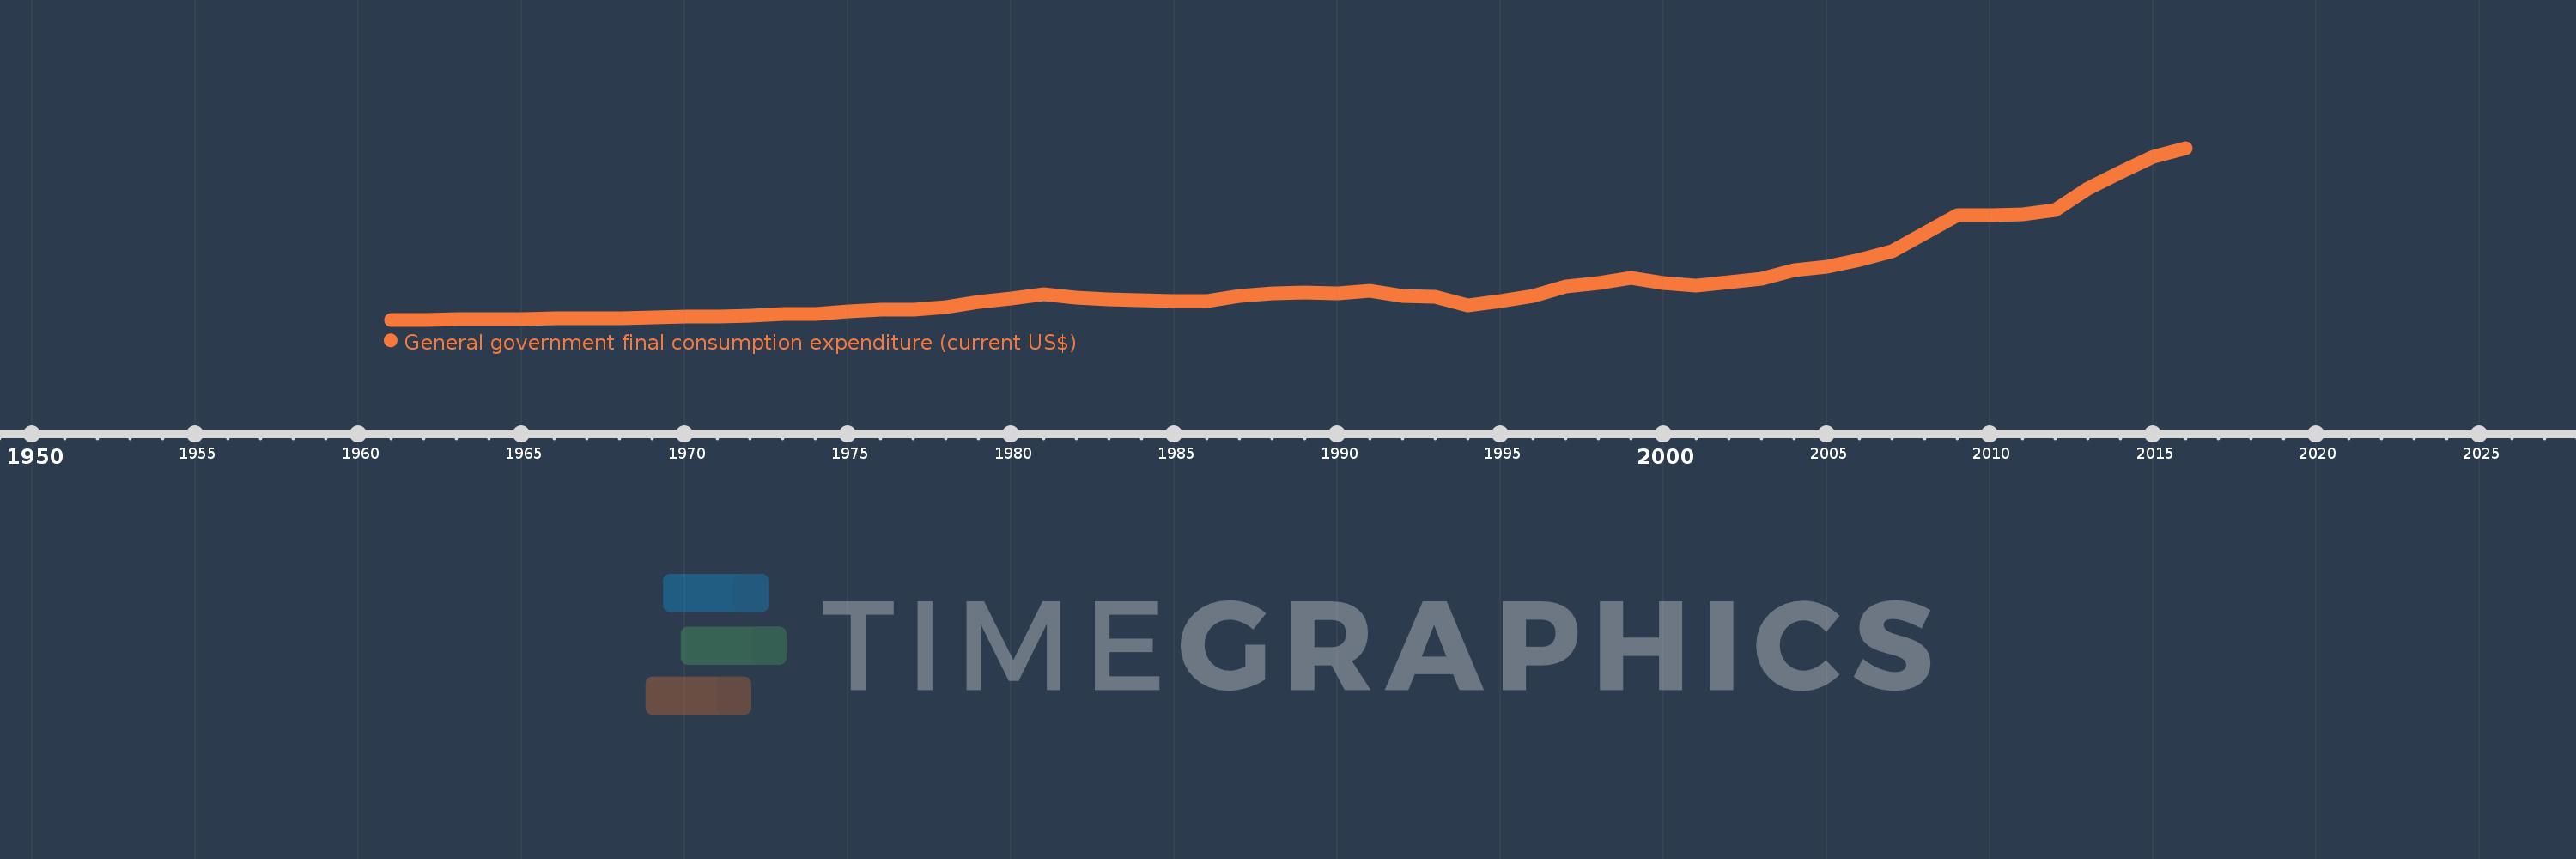
General government final consumption expenditure (current US$)
2016,2015,2014,2013,2012,2011,2010,2009,2008,2007,2006,2005,2004,2003,2002,2001,2000,1999,1998,1997,1996,1995,1994,1993,1992,1991,1990,1989,1988,1987,1986,1985,1984,1983,1982,1981,1980,1979,1978,1977,1976,1975,1974,1973,1972,1971,1970,1969,1968,1967,1966,1965,1964,1963,1962,1961
This statistics in other country:
AfghanistanAlbaniaAlgeriaAngolaAntigua and BarbudaArab WorldArgentinaArmeniaArubaAustraliaAustriaAzerbaijanBahamas, TheBahrainBangladeshBarbadosBelarusBelgiumBelizeBeninBermudaBhutanBoliviaBosnia and HerzegovinaBotswanaBrazilBrunei DarussalamBulgariaBurkina FasoBurundiCabo VerdeCambodiaCameroonCanadaCaribbean small statesCentral African RepublicCentral Europe and the BalticsChadChileChinaColombiaComorosCongo, Dem. Rep.Congo, Rep.Costa RicaCote d'IvoireCroatiaCubaCyprusCzech RepublicDenmarkDjiboutiDominicaDominican RepublicEarly-demographic dividendEast Asia & PacificEast Asia & Pacific (excluding high income)East Asia & Pacific (IDA & IBRD countries)EcuadorEgypt, Arab Rep.El SalvadorEquatorial GuineaEritreaEstoniaEthiopiaEuro areaEurope & Central AsiaEurope & Central Asia (excluding high income)Europe & Central Asia (IDA & IBRD countries)European UnionFaroe IslandsFijiFinlandFragile and conflict affected situationsFranceFrench PolynesiaGabonGambia, TheGeorgiaGermanyGhanaGreeceGrenadaGuatemalaGuineaGuinea-BissauGuyanaHaitiHeavily indebted poor countries (HIPC)High incomeHondurasHong Kong SAR, ChinaHungaryIBRD onlyIcelandIDA & IBRD totalIDA blendIDA onlyIDA totalIndiaIndonesiaIran, Islamic Rep.IraqIrelandIsraelItalyJamaicaJapanJordanKazakhstanKenyaKiribatiKorea, Rep.KosovoKuwaitKyrgyz RepublicLao PDRLate-demographic dividendLatin America & Caribbean Latin America & Caribbean (excluding high income)Latin America & the Caribbean (IDA & IBRD countries)LatviaLeast developed countries: UN classificationLebanonLesothoLiberiaLibyaLithuaniaLow & middle incomeLow incomeLower middle incomeLuxembourgMacao SAR, ChinaMacedonia, FYRMadagascarMalawiMalaysiaMaldivesMaliMaltaMauritaniaMauritiusMexicoMicronesia, Fed. Sts.Middle East & North AfricaMiddle East & North Africa (excluding high income)Middle East & North Africa (IDA & IBRD countries)Middle incomeMoldovaMongoliaMontenegroMoroccoMozambiqueNamibiaNepalNetherlandsNew CaledoniaNew ZealandNicaraguaNigerNigeriaNorth AmericaNorwayOECD membersOmanOther small statesPakistanPanamaPapua New GuineaParaguayPeruPhilippinesPolandPortugalPost-demographic dividendPre-demographic dividendPuerto RicoQatarRomaniaRussian FederationRwandaSaudi ArabiaSenegalSerbiaSeychellesSierra LeoneSingaporeSlovak RepublicSloveniaSmall statesSolomon IslandsSomaliaSouth AfricaSouth AsiaSouth Asia (IDA & IBRD)South SudanSpainSri LankaSt. Kitts and NevisSt. LuciaSt. Vincent and the GrenadinesSub-Saharan Africa Sub-Saharan Africa (excluding high income)Sub-Saharan Africa (IDA & IBRD countries)SudanSurinameSwazilandSwedenSwitzerlandSyrian Arab RepublicTajikistanTanzaniaThailandTimor-LesteTogoTongaTrinidad and TobagoTunisiaTurkeyTurkmenistanUgandaUkraineUnited Arab EmiratesUnited KingdomUnited StatesUpper middle incomeUruguayUzbekistanVanuatuVenezuela, RBVietnamWest Bank and GazaWorldYemen, Rep.ZambiaZimbabwe Timeline:
This timeline shows a graph from 1961 to 2016 of Kenya. No data until 1960. Number of actual observations by date: 56.
Source name:
World Development Indicators
Source organization:
World Bank national accounts data, and OECD National Accounts data files.
Categories, topics:
Economy & Growth
Last updated:
apr 23, 2017
Indicators value changes by year
Minimum:
86.716 mln
jan 1, 1961
Maximum:
9.187 bln
jan 1, 2016
At the date of observation
Value
Absolute change
Change from previous value
jan 1, 1961
86.716 mln
+86.716 mln
0.0%
jan 1, 1962
95.382 mln
+8.666 mln
9.99%
jan 1, 1963
100.702 mln
+5.32 mln
5.58%
jan 1, 1964
106.288 mln
+5.586 mln
5.55%
jan 1, 1965
138.32 mln
+32.032 mln
30.14%
jan 1, 1966
148.12 mln
+9.8 mln
7.09%
jan 1, 1967
159.88 mln
+11.76 mln
7.94%
jan 1, 1968
174.16 mln
+14.28 mln
8.93%
jan 1, 1969
205.8 mln
+31.64 mln
18.17%
jan 1, 1970
239.68 mln
+33.88 mln
16.46%
jan 1, 1971
260.68 mln
+21.0 mln
8.76%
jan 1, 1972
319.76 mln
+59.08 mln
22.66%
jan 1, 1973
371.56 mln
+51.8 mln
16.2%
jan 1, 1974
411.658 mln
+40.099 mln
10.79%
jan 1, 1975
506.531 mln
+94.872 mln
23.05%
jan 1, 1976
597.288 mln
+90.757 mln
17.92%
jan 1, 1977
606.659 mln
+9.371 mln
1.57%
jan 1, 1978
773.268 mln
+166.609 mln
27.46%
jan 1, 1979
1.035 bln
+261.743 mln
33.85%
jan 1, 1980
1.197 bln
+161.728 mln
15.63%
jan 1, 1981
1.439 bln
+242.038 mln
20.22%
jan 1, 1982
1.274 bln
-164.613 mln
-11.44%
jan 1, 1983
1.186 bln
-88.629 mln
-6.96%
jan 1, 1984
1.101 bln
-84.068 mln
-7.09%
jan 1, 1985
1.076 bln
-25.282 mln
-2.3%
jan 1, 1986
1.071 bln
-4.99 mln
-0.46%
jan 1, 1987
1.326 bln
+254.982 mln
23.8%
jan 1, 1988
1.48 bln
+153.906 mln
11.61%
jan 1, 1989
1.538 bln
+57.792 mln
3.9%
jan 1, 1990
1.496 bln
-42.224 mln
-2.75%
jan 1, 1991
1.598 bln
+102.447 mln
6.85%
jan 1, 1992
1.367 bln
-230.983 mln
-14.45%
jan 1, 1993
1.287 bln
-79.735 mln
-5.83%
jan 1, 1994
832.857 mln
-454.521 mln
-35.31%
jan 1, 1995
1.083 bln
+250.439 mln
30.07%
jan 1, 1996
1.343 bln
+259.443 mln
23.95%
jan 1, 1997
1.829 bln
+485.891 mln
36.19%
jan 1, 1998
2.038 bln
+209.057 mln
11.43%
jan 1, 1999
2.29 bln
+252.583 mln
12.4%
jan 1, 2000
2.032 bln
-258.722 mln
-11.3%
jan 1, 2001
1.913 bln
-118.846 mln
-5.85%
jan 1, 2002
2.074 bln
+161.542 mln
8.45%
jan 1, 2003
2.245 bln
+171.128 mln
8.25%
jan 1, 2004
2.702 bln
+457.014 mln
20.35%
jan 1, 2005
2.875 bln
+172.252 mln
6.37%
jan 1, 2006
3.257 bln
+382.048 mln
13.29%
jan 1, 2007
3.705 bln
+448.502 mln
13.77%
jan 1, 2008
4.675 bln
+970.172 mln
26.18%
jan 1, 2009
5.626 bln
+950.839 mln
20.34%
jan 1, 2010
5.633 bln
+6.429 mln
0.11%
jan 1, 2011
5.665 bln
+32.624 mln
0.58%
jan 1, 2012
5.878 bln
+213.11 mln
3.76%
jan 1, 2013
7.052 bln
+1.173 bln
19.96%
jan 1, 2014
7.899 bln
+847.135 mln
12.01%
jan 1, 2015
8.713 bln
+813.9 mln
10.3%
jan 1, 2016
9.187 bln
+474.836 mln
5.45%
Ranking of countries by current statistics by years


Comments: