29
/
en
AIzaSyAYiBZKx7MnpbEhh9jyipgxe19OcubqV5w
April 1, 2024
256350
Sweden
SWE
true
2
1
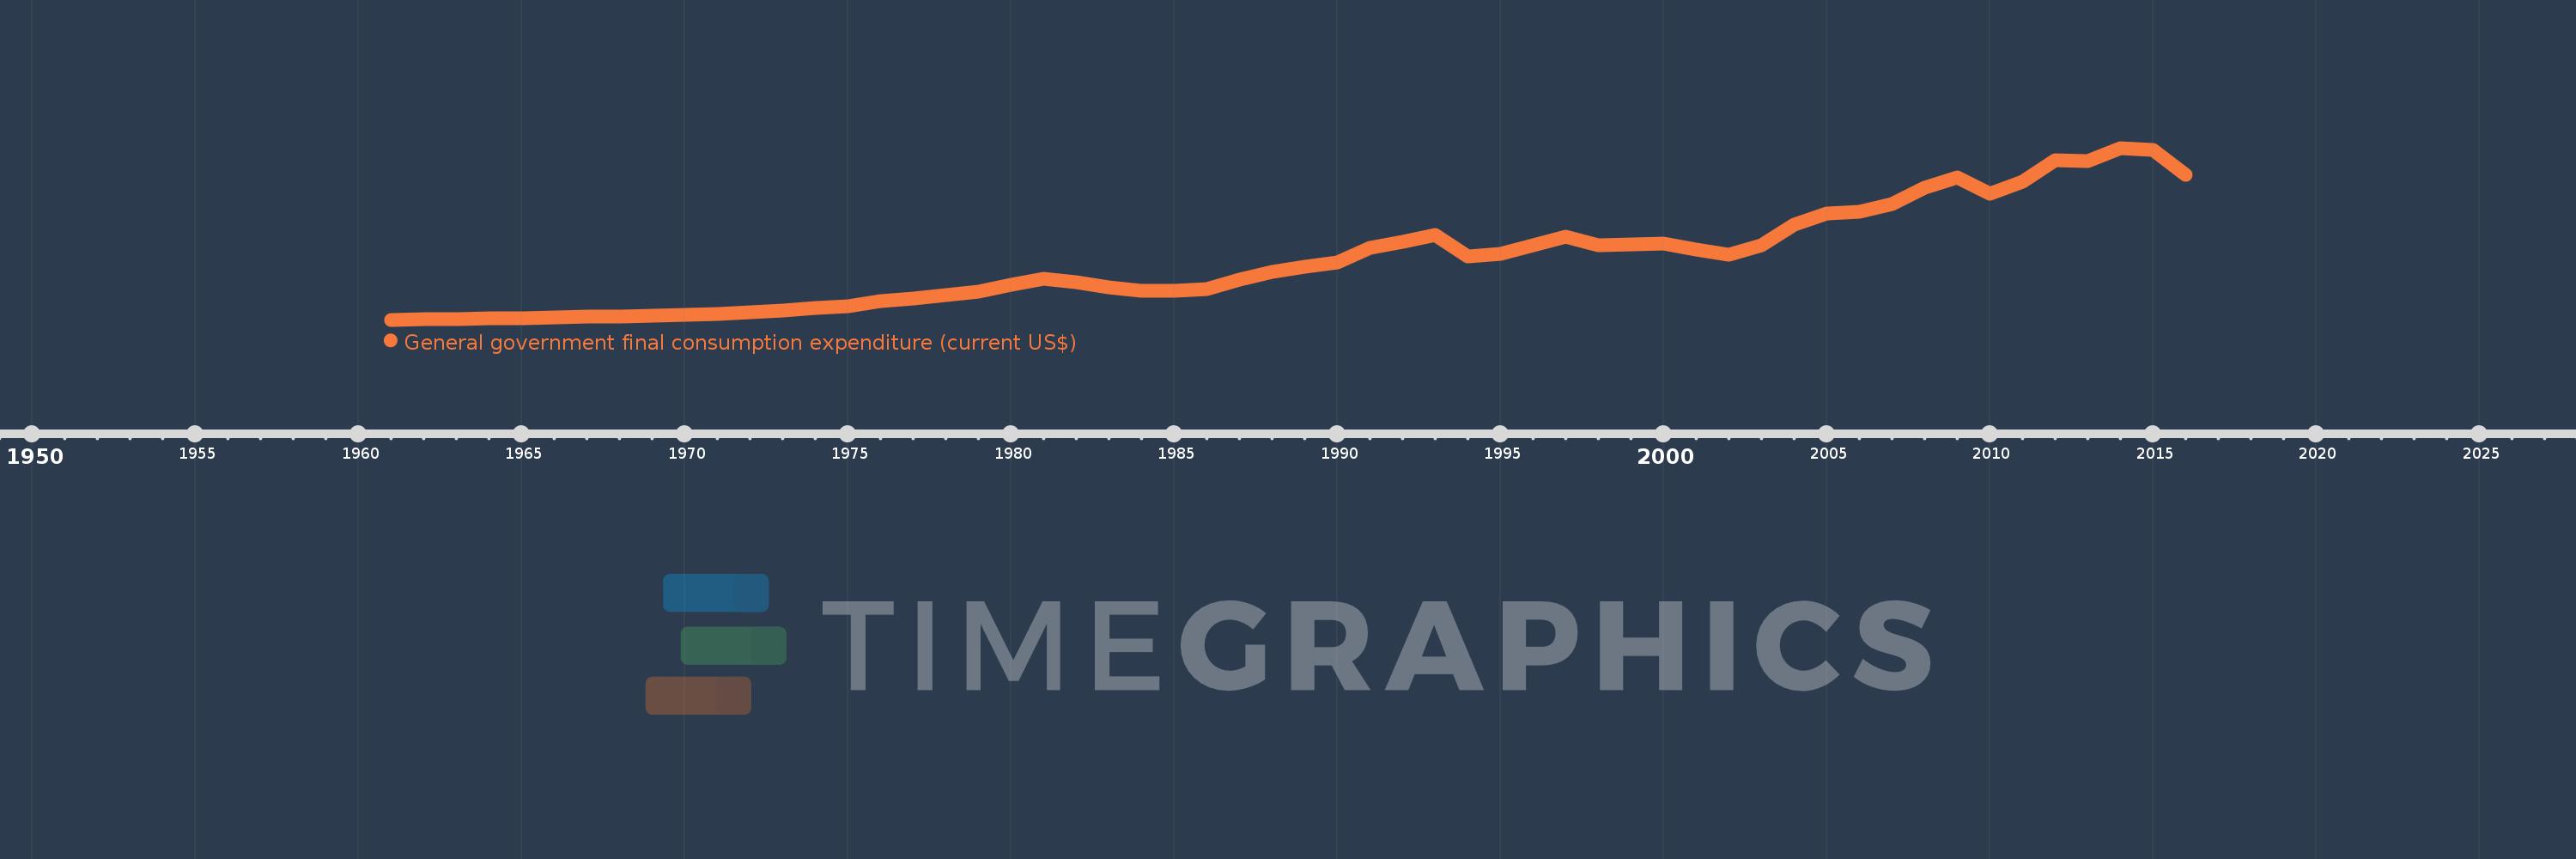
General government final consumption expenditure (current US$)
2016,2015,2014,2013,2012,2011,2010,2009,2008,2007,2006,2005,2004,2003,2002,2001,2000,1999,1998,1997,1996,1995,1994,1993,1992,1991,1990,1989,1988,1987,1986,1985,1984,1983,1982,1981,1980,1979,1978,1977,1976,1975,1974,1973,1972,1971,1970,1969,1968,1967,1966,1965,1964,1963,1962,1961
This statistics in other country:
AfghanistanAlbaniaAlgeriaAngolaAntigua and BarbudaArab WorldArgentinaArmeniaArubaAustraliaAustriaAzerbaijanBahamas, TheBahrainBangladeshBarbadosBelarusBelgiumBelizeBeninBermudaBhutanBoliviaBosnia and HerzegovinaBotswanaBrazilBrunei DarussalamBulgariaBurkina FasoBurundiCabo VerdeCambodiaCameroonCanadaCaribbean small statesCentral African RepublicCentral Europe and the BalticsChadChileChinaColombiaComorosCongo, Dem. Rep.Congo, Rep.Costa RicaCote d'IvoireCroatiaCubaCyprusCzech RepublicDenmarkDjiboutiDominicaDominican RepublicEarly-demographic dividendEast Asia & PacificEast Asia & Pacific (excluding high income)East Asia & Pacific (IDA & IBRD countries)EcuadorEgypt, Arab Rep.El SalvadorEquatorial GuineaEritreaEstoniaEthiopiaEuro areaEurope & Central AsiaEurope & Central Asia (excluding high income)Europe & Central Asia (IDA & IBRD countries)European UnionFaroe IslandsFijiFinlandFragile and conflict affected situationsFranceFrench PolynesiaGabonGambia, TheGeorgiaGermanyGhanaGreeceGrenadaGuatemalaGuineaGuinea-BissauGuyanaHaitiHeavily indebted poor countries (HIPC)High incomeHondurasHong Kong SAR, ChinaHungaryIBRD onlyIcelandIDA & IBRD totalIDA blendIDA onlyIDA totalIndiaIndonesiaIran, Islamic Rep.IraqIrelandIsraelItalyJamaicaJapanJordanKazakhstanKenyaKiribatiKorea, Rep.KosovoKuwaitKyrgyz RepublicLao PDRLate-demographic dividendLatin America & Caribbean Latin America & Caribbean (excluding high income)Latin America & the Caribbean (IDA & IBRD countries)LatviaLeast developed countries: UN classificationLebanonLesothoLiberiaLibyaLithuaniaLow & middle incomeLow incomeLower middle incomeLuxembourgMacao SAR, ChinaMacedonia, FYRMadagascarMalawiMalaysiaMaldivesMaliMaltaMauritaniaMauritiusMexicoMicronesia, Fed. Sts.Middle East & North AfricaMiddle East & North Africa (excluding high income)Middle East & North Africa (IDA & IBRD countries)Middle incomeMoldovaMongoliaMontenegroMoroccoMozambiqueNamibiaNepalNetherlandsNew CaledoniaNew ZealandNicaraguaNigerNigeriaNorth AmericaNorwayOECD membersOmanOther small statesPakistanPanamaPapua New GuineaParaguayPeruPhilippinesPolandPortugalPost-demographic dividendPre-demographic dividendPuerto RicoQatarRomaniaRussian FederationRwandaSaudi ArabiaSenegalSerbiaSeychellesSierra LeoneSingaporeSlovak RepublicSloveniaSmall statesSolomon IslandsSomaliaSouth AfricaSouth AsiaSouth Asia (IDA & IBRD)South SudanSpainSri LankaSt. Kitts and NevisSt. LuciaSt. Vincent and the GrenadinesSub-Saharan Africa Sub-Saharan Africa (excluding high income)Sub-Saharan Africa (IDA & IBRD countries)SudanSurinameSwazilandSwedenSwitzerlandSyrian Arab RepublicTajikistanTanzaniaThailandTimor-LesteTogoTongaTrinidad and TobagoTunisiaTurkeyTurkmenistanUgandaUkraineUnited Arab EmiratesUnited KingdomUnited StatesUpper middle incomeUruguayUzbekistanVanuatuVenezuela, RBVietnamWest Bank and GazaWorldYemen, Rep.ZambiaZimbabwe Timeline:
This timeline shows a graph from 1961 to 2016 of Sweden. No data until 1960. Number of actual observations by date: 56.
Source name:
World Development Indicators
Source organization:
World Bank national accounts data, and OECD National Accounts data files.
Categories, topics:
Economy & Growth
Last updated:
apr 23, 2017
Indicators value changes by year
Minimum:
2.383 bln
jan 1, 1961
Maximum:
152.385 bln
jan 1, 2014
At the date of observation
Value
Absolute change
Change from previous value
jan 1, 1961
2.383 bln
+2.383 bln
0.0%
jan 1, 1962
2.594 bln
+210.495 mln
8.83%
jan 1, 1963
2.966 bln
+371.819 mln
14.33%
jan 1, 1964
3.312 bln
+346.016 mln
11.67%
jan 1, 1965
3.672 bln
+360.848 mln
10.9%
jan 1, 1966
4.173 bln
+500.026 mln
13.62%
jan 1, 1967
4.829 bln
+656.89 mln
15.74%
jan 1, 1968
5.417 bln
+587.383 mln
12.16%
jan 1, 1969
6.052 bln
+635.552 mln
11.73%
jan 1, 1970
6.639 bln
+586.373 mln
9.69%
jan 1, 1971
7.632 bln
+993.105 mln
14.96%
jan 1, 1972
8.728 bln
+1.096 bln
14.37%
jan 1, 1973
10.388 bln
+1.659 bln
19.01%
jan 1, 1974
12.584 bln
+2.196 bln
21.14%
jan 1, 1975
14.308 bln
+1.724 bln
13.7%
jan 1, 1976
18.424 bln
+4.116 bln
28.77%
jan 1, 1977
20.757 bln
+2.333 bln
12.66%
jan 1, 1978
24.249 bln
+3.492 bln
16.82%
jan 1, 1979
27.235 bln
+2.986 bln
12.31%
jan 1, 1980
32.594 bln
+5.359 bln
19.68%
jan 1, 1981
38.277 bln
+5.683 bln
17.44%
jan 1, 1982
35.33 bln
-2.947 bln
-7.7%
jan 1, 1983
30.985 bln
-4.345 bln
-12.3%
jan 1, 1984
27.804 bln
-3.18 bln
-10.26%
jan 1, 1985
27.936 bln
+131.658 mln
0.47%
jan 1, 1986
28.848 bln
+911.702 mln
3.26%
jan 1, 1987
37.592 bln
+8.745 bln
30.31%
jan 1, 1988
44.389 bln
+6.797 bln
18.08%
jan 1, 1989
48.869 bln
+4.48 bln
10.09%
jan 1, 1990
52.037 bln
+3.168 bln
6.48%
jan 1, 1991
65.228 bln
+13.191 bln
25.35%
jan 1, 1992
70.551 bln
+5.323 bln
8.16%
jan 1, 1993
76.147 bln
+5.596 bln
7.93%
jan 1, 1994
57.717 bln
-18.43 bln
-24.2%
jan 1, 1995
59.834 bln
+2.117 bln
3.67%
jan 1, 1996
67.387 bln
+7.553 bln
12.62%
jan 1, 1997
74.59 bln
+7.203 bln
10.69%
jan 1, 1998
67.204 bln
-7.386 bln
-9.9%
jan 1, 1999
68.038 bln
+834.06 mln
1.24%
jan 1, 2000
68.875 bln
+836.689 mln
1.23%
jan 1, 2001
63.748 bln
-5.127 bln
-7.44%
jan 1, 2002
59.312 bln
-4.436 bln
-6.96%
jan 1, 2003
67.233 bln
+7.921 bln
13.36%
jan 1, 2004
85.135 bln
+17.901 bln
26.63%
jan 1, 2005
95.391 bln
+10.257 bln
12.05%
jan 1, 2006
96.699 bln
+1.308 bln
1.37%
jan 1, 2007
103.217 bln
+6.518 bln
6.74%
jan 1, 2008
117.396 bln
+14.18 bln
13.74%
jan 1, 2009
126.438 bln
+9.041 bln
7.7%
jan 1, 2010
112.437 bln
-14.001 bln
-11.07%
jan 1, 2011
122.979 bln
+10.542 bln
9.38%
jan 1, 2012
141.806 bln
+18.827 bln
15.31%
jan 1, 2013
140.946 bln
-860.17 mln
-0.61%
jan 1, 2014
152.385 bln
+11.439 bln
8.12%
jan 1, 2015
150.349 bln
-2.036 bln
-1.34%
jan 1, 2016
128.574 bln
-21.775 bln
-14.48%
Ranking of countries by current statistics by years


Comments: