29
/
en
AIzaSyAYiBZKx7MnpbEhh9jyipgxe19OcubqV5w
April 1, 2024
259601
Tajikistan
TJK
true
2
1
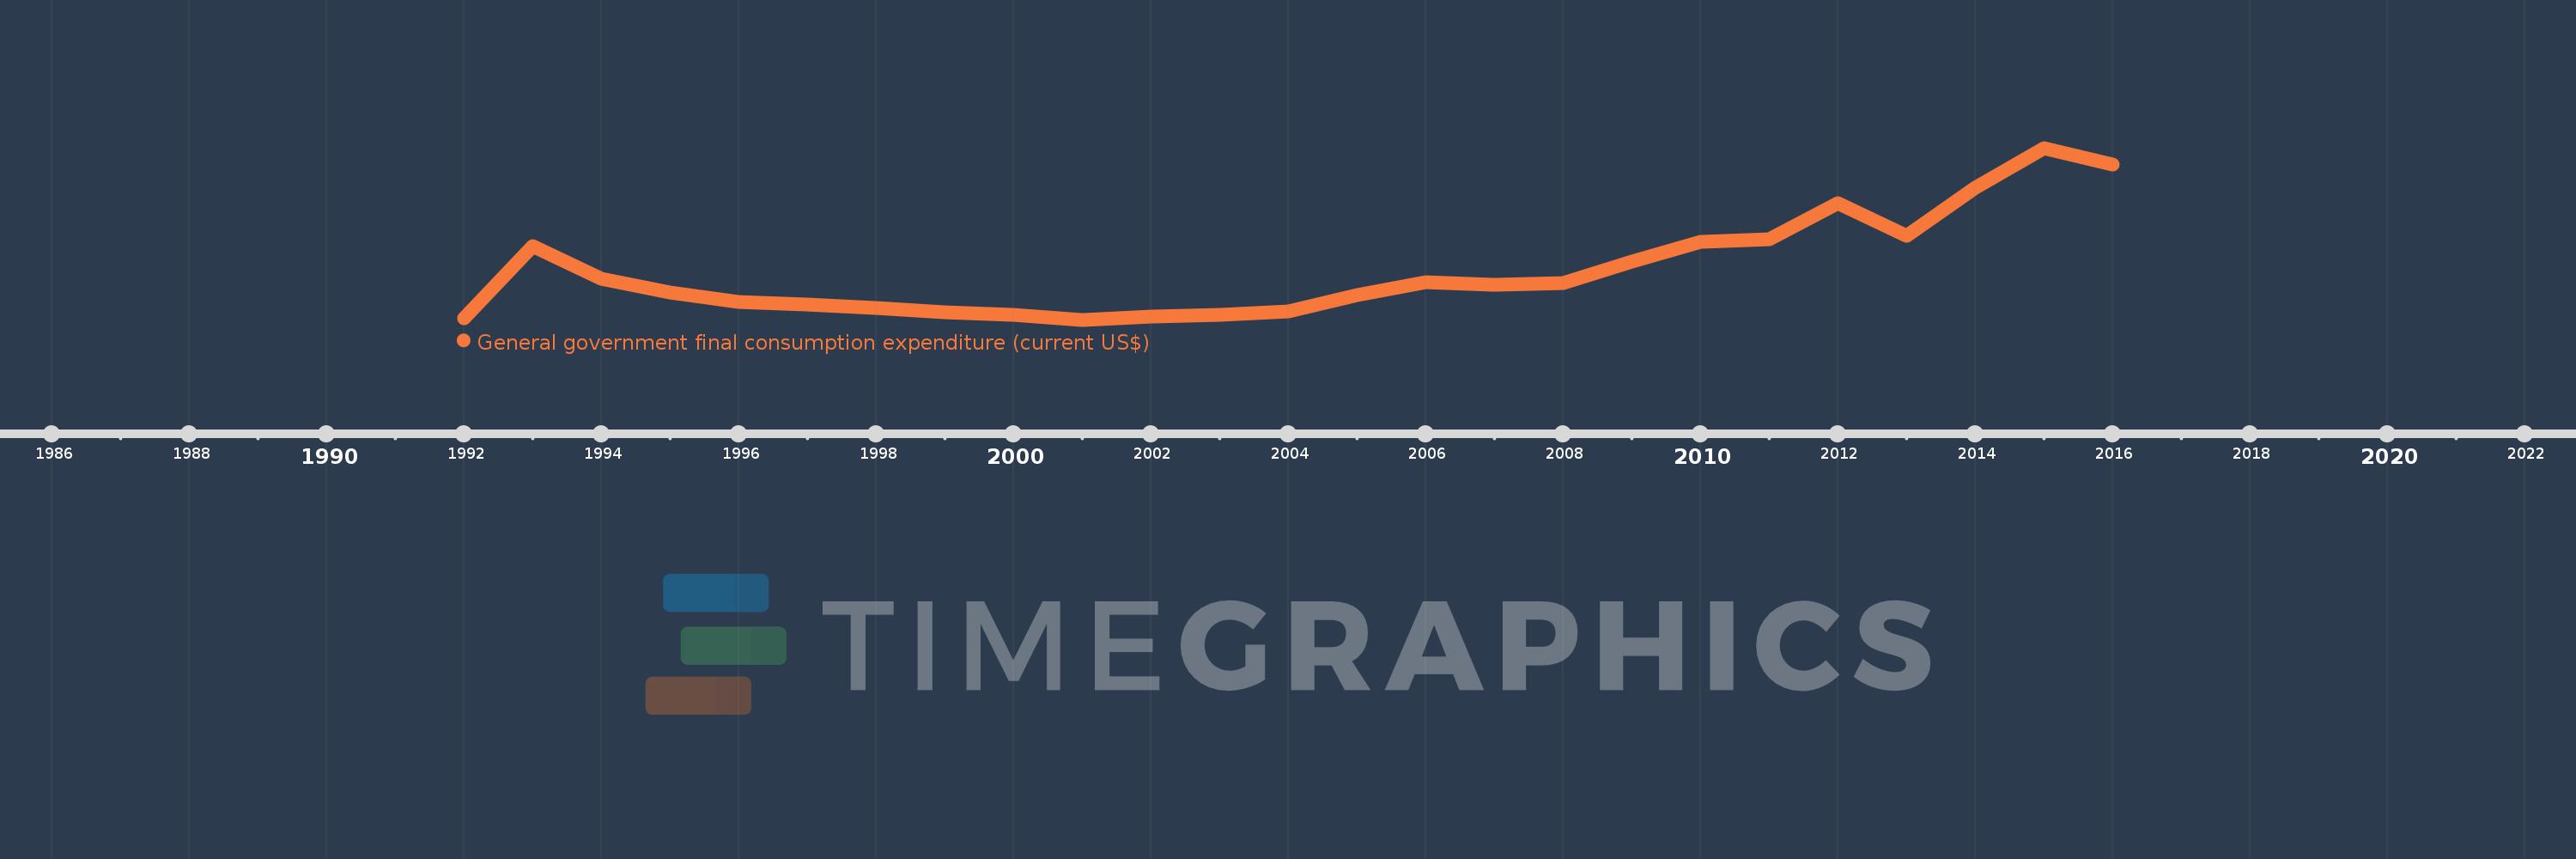
General government final consumption expenditure (current US$)
2016,2015,2014,2013,2012,2011,2010,2009,2008,2007,2006,2005,2004,2003,2002,2001,2000,1999,1998,1997,1996,1995,1994,1993,1992
This statistics in other country:
AfghanistanAlbaniaAlgeriaAngolaAntigua and BarbudaArab WorldArgentinaArmeniaArubaAustraliaAustriaAzerbaijanBahamas, TheBahrainBangladeshBarbadosBelarusBelgiumBelizeBeninBermudaBhutanBoliviaBosnia and HerzegovinaBotswanaBrazilBrunei DarussalamBulgariaBurkina FasoBurundiCabo VerdeCambodiaCameroonCanadaCaribbean small statesCentral African RepublicCentral Europe and the BalticsChadChileChinaColombiaComorosCongo, Dem. Rep.Congo, Rep.Costa RicaCote d'IvoireCroatiaCubaCyprusCzech RepublicDenmarkDjiboutiDominicaDominican RepublicEarly-demographic dividendEast Asia & PacificEast Asia & Pacific (excluding high income)East Asia & Pacific (IDA & IBRD countries)EcuadorEgypt, Arab Rep.El SalvadorEquatorial GuineaEritreaEstoniaEthiopiaEuro areaEurope & Central AsiaEurope & Central Asia (excluding high income)Europe & Central Asia (IDA & IBRD countries)European UnionFaroe IslandsFijiFinlandFragile and conflict affected situationsFranceFrench PolynesiaGabonGambia, TheGeorgiaGermanyGhanaGreeceGrenadaGuatemalaGuineaGuinea-BissauGuyanaHaitiHeavily indebted poor countries (HIPC)High incomeHondurasHong Kong SAR, ChinaHungaryIBRD onlyIcelandIDA & IBRD totalIDA blendIDA onlyIDA totalIndiaIndonesiaIran, Islamic Rep.IraqIrelandIsraelItalyJamaicaJapanJordanKazakhstanKenyaKiribatiKorea, Rep.KosovoKuwaitKyrgyz RepublicLao PDRLate-demographic dividendLatin America & Caribbean Latin America & Caribbean (excluding high income)Latin America & the Caribbean (IDA & IBRD countries)LatviaLeast developed countries: UN classificationLebanonLesothoLiberiaLibyaLithuaniaLow & middle incomeLow incomeLower middle incomeLuxembourgMacao SAR, ChinaMacedonia, FYRMadagascarMalawiMalaysiaMaldivesMaliMaltaMauritaniaMauritiusMexicoMicronesia, Fed. Sts.Middle East & North AfricaMiddle East & North Africa (excluding high income)Middle East & North Africa (IDA & IBRD countries)Middle incomeMoldovaMongoliaMontenegroMoroccoMozambiqueNamibiaNepalNetherlandsNew CaledoniaNew ZealandNicaraguaNigerNigeriaNorth AmericaNorwayOECD membersOmanOther small statesPakistanPanamaPapua New GuineaParaguayPeruPhilippinesPolandPortugalPost-demographic dividendPre-demographic dividendPuerto RicoQatarRomaniaRussian FederationRwandaSaudi ArabiaSenegalSerbiaSeychellesSierra LeoneSingaporeSlovak RepublicSloveniaSmall statesSolomon IslandsSomaliaSouth AfricaSouth AsiaSouth Asia (IDA & IBRD)South SudanSpainSri LankaSt. Kitts and NevisSt. LuciaSt. Vincent and the GrenadinesSub-Saharan Africa Sub-Saharan Africa (excluding high income)Sub-Saharan Africa (IDA & IBRD countries)SudanSurinameSwazilandSwedenSwitzerlandSyrian Arab RepublicTajikistanTanzaniaThailandTimor-LesteTogoTongaTrinidad and TobagoTunisiaTurkeyTurkmenistanUgandaUkraineUnited Arab EmiratesUnited KingdomUnited StatesUpper middle incomeUruguayUzbekistanVanuatuVenezuela, RBVietnamWest Bank and GazaWorldYemen, Rep.ZambiaZimbabwe Timeline:
This timeline shows a graph from 1992 to 2016 of Tajikistan. No data until 1991. Number of actual observations by date: 25.
Source name:
World Development Indicators
Source organization:
World Bank national accounts data, and OECD National Accounts data files.
Categories, topics:
Economy & Growth
Last updated:
apr 23, 2017
Indicators value changes by year
Minimum:
71.343 mln
jan 1, 2001
Maximum:
1.279 bln
jan 1, 2015
At the date of observation
Value
Absolute change
Change from previous value
jan 1, 1992
80.0 mln
+80.0 mln
0.0%
jan 1, 1993
586.667 mln
+506.667 mln
633.33%
jan 1, 1994
360.233 mln
-226.434 mln
-38.6%
jan 1, 1995
264.459 mln
-95.774 mln
-26.59%
jan 1, 1996
194.586 mln
-69.873 mln
-26.42%
jan 1, 1997
175.574 mln
-19.012 mln
-9.77%
jan 1, 1998
152.113 mln
-23.46 mln
-13.36%
jan 1, 1999
125.669 mln
-26.445 mln
-17.38%
jan 1, 2000
107.857 mln
-17.811 mln
-14.17%
jan 1, 2001
71.343 mln
-36.514 mln
-33.85%
jan 1, 2002
93.584 mln
+22.241 mln
31.17%
jan 1, 2003
105.002 mln
+11.418 mln
12.2%
jan 1, 2004
128.534 mln
+23.532 mln
22.41%
jan 1, 2005
244.673 mln
+116.138 mln
90.36%
jan 1, 2006
337.611 mln
+92.939 mln
37.98%
jan 1, 2007
314.274 mln
-23.338 mln
-6.91%
jan 1, 2008
331.184 mln
+16.91 mln
5.38%
jan 1, 2009
481.738 mln
+150.555 mln
45.46%
jan 1, 2010
620.561 mln
+138.823 mln
28.82%
jan 1, 2011
639.073 mln
+18.511 mln
2.98%
jan 1, 2012
890.569 mln
+251.496 mln
39.35%
jan 1, 2013
660.025 mln
-230.544 mln
-25.89%
jan 1, 2014
998.699 mln
+338.674 mln
51.31%
jan 1, 2015
1.279 bln
+280.688 mln
28.11%
jan 1, 2016
1.161 bln
-118.103 mln
-9.23%
Ranking of countries by current statistics by years


Comments: