29
/
en
AIzaSyAYiBZKx7MnpbEhh9jyipgxe19OcubqV5w
April 1, 2024
182093
Luxembourg
LUX
true
2
1
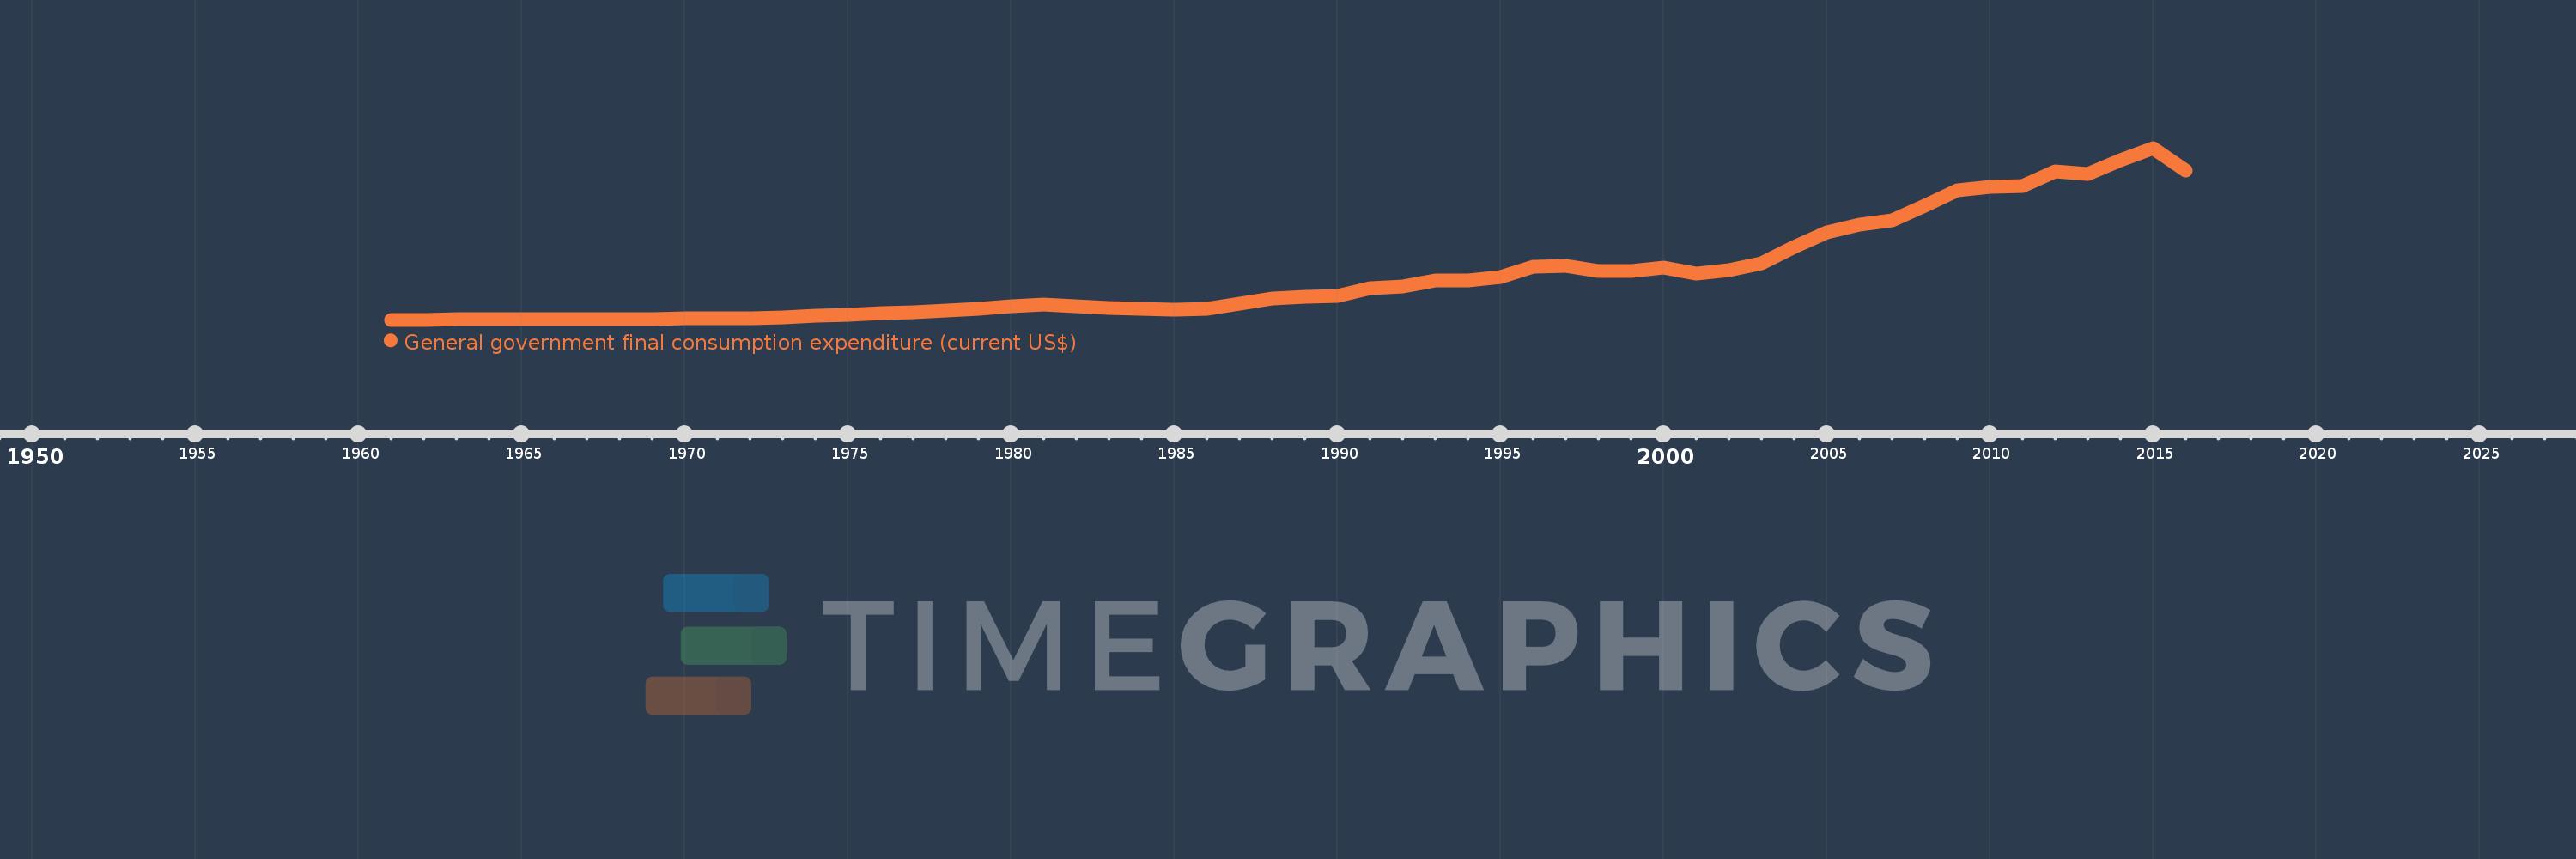
General government final consumption expenditure (current US$)
2016,2015,2014,2013,2012,2011,2010,2009,2008,2007,2006,2005,2004,2003,2002,2001,2000,1999,1998,1997,1996,1995,1994,1993,1992,1991,1990,1989,1988,1987,1986,1985,1984,1983,1982,1981,1980,1979,1978,1977,1976,1975,1974,1973,1972,1971,1970,1969,1968,1967,1966,1965,1964,1963,1962,1961
This statistics in other country:
AfghanistanAlbaniaAlgeriaAngolaAntigua and BarbudaArab WorldArgentinaArmeniaArubaAustraliaAustriaAzerbaijanBahamas, TheBahrainBangladeshBarbadosBelarusBelgiumBelizeBeninBermudaBhutanBoliviaBosnia and HerzegovinaBotswanaBrazilBrunei DarussalamBulgariaBurkina FasoBurundiCabo VerdeCambodiaCameroonCanadaCaribbean small statesCentral African RepublicCentral Europe and the BalticsChadChileChinaColombiaComorosCongo, Dem. Rep.Congo, Rep.Costa RicaCote d'IvoireCroatiaCubaCyprusCzech RepublicDenmarkDjiboutiDominicaDominican RepublicEarly-demographic dividendEast Asia & PacificEast Asia & Pacific (excluding high income)East Asia & Pacific (IDA & IBRD countries)EcuadorEgypt, Arab Rep.El SalvadorEquatorial GuineaEritreaEstoniaEthiopiaEuro areaEurope & Central AsiaEurope & Central Asia (excluding high income)Europe & Central Asia (IDA & IBRD countries)European UnionFaroe IslandsFijiFinlandFragile and conflict affected situationsFranceFrench PolynesiaGabonGambia, TheGeorgiaGermanyGhanaGreeceGrenadaGuatemalaGuineaGuinea-BissauGuyanaHaitiHeavily indebted poor countries (HIPC)High incomeHondurasHong Kong SAR, ChinaHungaryIBRD onlyIcelandIDA & IBRD totalIDA blendIDA onlyIDA totalIndiaIndonesiaIran, Islamic Rep.IraqIrelandIsraelItalyJamaicaJapanJordanKazakhstanKenyaKiribatiKorea, Rep.KosovoKuwaitKyrgyz RepublicLao PDRLate-demographic dividendLatin America & Caribbean Latin America & Caribbean (excluding high income)Latin America & the Caribbean (IDA & IBRD countries)LatviaLeast developed countries: UN classificationLebanonLesothoLiberiaLibyaLithuaniaLow & middle incomeLow incomeLower middle incomeLuxembourgMacao SAR, ChinaMacedonia, FYRMadagascarMalawiMalaysiaMaldivesMaliMaltaMauritaniaMauritiusMexicoMicronesia, Fed. Sts.Middle East & North AfricaMiddle East & North Africa (excluding high income)Middle East & North Africa (IDA & IBRD countries)Middle incomeMoldovaMongoliaMontenegroMoroccoMozambiqueNamibiaNepalNetherlandsNew CaledoniaNew ZealandNicaraguaNigerNigeriaNorth AmericaNorwayOECD membersOmanOther small statesPakistanPanamaPapua New GuineaParaguayPeruPhilippinesPolandPortugalPost-demographic dividendPre-demographic dividendPuerto RicoQatarRomaniaRussian FederationRwandaSaudi ArabiaSenegalSerbiaSeychellesSierra LeoneSingaporeSlovak RepublicSloveniaSmall statesSolomon IslandsSomaliaSouth AfricaSouth AsiaSouth Asia (IDA & IBRD)South SudanSpainSri LankaSt. Kitts and NevisSt. LuciaSt. Vincent and the GrenadinesSub-Saharan Africa Sub-Saharan Africa (excluding high income)Sub-Saharan Africa (IDA & IBRD countries)SudanSurinameSwazilandSwedenSwitzerlandSyrian Arab RepublicTajikistanTanzaniaThailandTimor-LesteTogoTongaTrinidad and TobagoTunisiaTurkeyTurkmenistanUgandaUkraineUnited Arab EmiratesUnited KingdomUnited StatesUpper middle incomeUruguayUzbekistanVanuatuVenezuela, RBVietnamWest Bank and GazaWorldYemen, Rep.ZambiaZimbabwe Timeline:
This timeline shows a graph from 1961 to 2016 of Luxembourg. No data until 1960. Number of actual observations by date: 56.
Source name:
World Development Indicators
Source organization:
World Bank national accounts data, and OECD National Accounts data files.
Categories, topics:
Economy & Growth
Last updated:
apr 23, 2017
Indicators value changes by year
Minimum:
71.983 mln
jan 1, 1961
Maximum:
11.072 bln
jan 1, 2015
At the date of observation
Value
Absolute change
Change from previous value
jan 1, 1961
71.983 mln
+71.983 mln
0.0%
jan 1, 1962
73.314 mln
+1.33 mln
1.85%
jan 1, 1963
84.621 mln
+11.307 mln
15.42%
jan 1, 1964
101.974 mln
+17.353 mln
20.51%
jan 1, 1965
102.065 mln
+90.697K
0.09%
jan 1, 1966
103.008 mln
+943.579K
0.92%
jan 1, 1967
113.128 mln
+10.12 mln
9.82%
jan 1, 1968
120.488 mln
+7.36 mln
6.51%
jan 1, 1969
131.7 mln
+11.212 mln
9.31%
jan 1, 1970
139.175 mln
+7.475 mln
5.68%
jan 1, 1971
162.648 mln
+23.473 mln
16.87%
jan 1, 1972
188.974 mln
+26.327 mln
16.19%
jan 1, 1973
237.41 mln
+48.436 mln
25.63%
jan 1, 1974
312.603 mln
+75.193 mln
31.67%
jan 1, 1975
387.556 mln
+74.953 mln
23.98%
jan 1, 1976
495.385 mln
+107.829 mln
27.82%
jan 1, 1977
535.779 mln
+40.394 mln
8.15%
jan 1, 1978
639.218 mln
+103.439 mln
19.31%
jan 1, 1979
784.078 mln
+144.86 mln
22.66%
jan 1, 1980
936.462 mln
+152.384 mln
19.43%
jan 1, 1981
1.067 bln
+130.661 mln
13.95%
jan 1, 1982
934.65 mln
-132.473 mln
-12.41%
jan 1, 1983
803.537 mln
-131.113 mln
-14.03%
jan 1, 1984
758.159 mln
-45.378 mln
-5.65%
jan 1, 1985
724.44 mln
-33.719 mln
-4.45%
jan 1, 1986
765.415 mln
+40.975 mln
5.66%
jan 1, 1987
1.093 bln
+327.45 mln
42.78%
jan 1, 1988
1.438 bln
+345.582 mln
31.62%
jan 1, 1989
1.548 bln
+109.679 mln
7.62%
jan 1, 1990
1.607 bln
+59.206 mln
3.82%
jan 1, 1991
2.093 bln
+485.72 mln
30.22%
jan 1, 1992
2.194 bln
+101.114 mln
4.83%
jan 1, 1993
2.56 bln
+366.305 mln
16.69%
jan 1, 1994
2.612 bln
+51.303 mln
2.0%
jan 1, 1995
2.821 bln
+209.082 mln
8.01%
jan 1, 1996
3.443 bln
+622.347 mln
22.06%
jan 1, 1997
3.497 bln
+53.479 mln
1.55%
jan 1, 1998
3.201 bln
-296.056 mln
-8.47%
jan 1, 1999
3.189 bln
-11.386 mln
-0.36%
jan 1, 2000
3.403 bln
+214.032 mln
6.71%
jan 1, 2001
3.031 bln
-372.025 mln
-10.93%
jan 1, 2002
3.231 bln
+200.161 mln
6.6%
jan 1, 2003
3.685 bln
+453.985 mln
14.05%
jan 1, 2004
4.729 bln
+1.043 bln
28.31%
jan 1, 2005
5.642 bln
+913.362 mln
19.32%
jan 1, 2006
6.15 bln
+508.562 mln
9.01%
jan 1, 2007
6.413 bln
+262.895 mln
4.27%
jan 1, 2008
7.361 bln
+947.289 mln
14.77%
jan 1, 2009
8.361 bln
+999.964 mln
13.59%
jan 1, 2010
8.591 bln
+230.371 mln
2.76%
jan 1, 2011
8.658 bln
+66.618 mln
0.78%
jan 1, 2012
9.563 bln
+905.075 mln
10.45%
jan 1, 2013
9.419 bln
-144.138 mln
-1.51%
jan 1, 2014
10.267 bln
+848.599 mln
9.01%
jan 1, 2015
11.072 bln
+804.441 mln
7.84%
jan 1, 2016
9.618 bln
-1.454 bln
-13.13%
Ranking of countries by current statistics by years


Comments: