29
/
en
AIzaSyAYiBZKx7MnpbEhh9jyipgxe19OcubqV5w
April 1, 2024
120952
Dominica
DMA
true
2
1
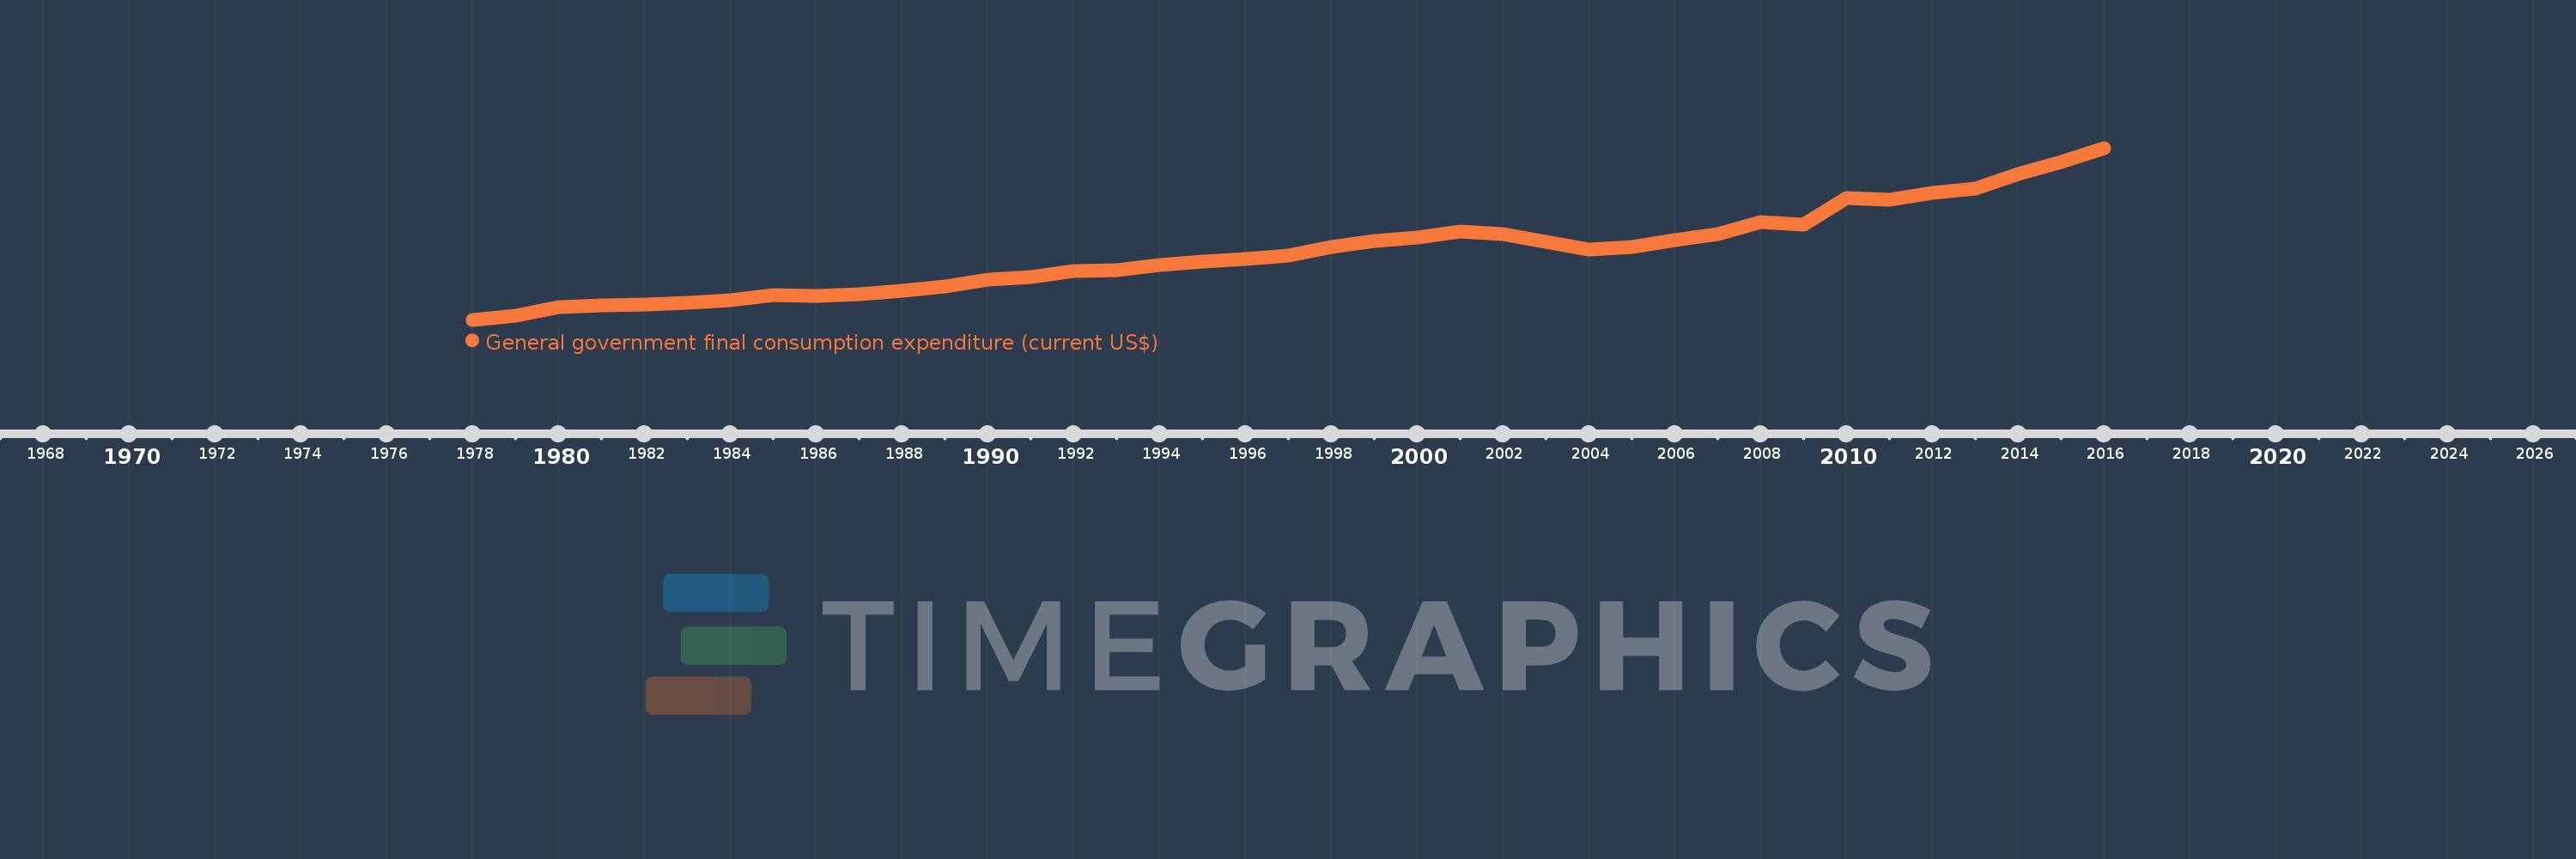
General government final consumption expenditure (current US$)
2016,2015,2014,2013,2012,2011,2010,2009,2008,2007,2006,2005,2004,2003,2002,2001,2000,1999,1998,1997,1996,1995,1994,1993,1992,1991,1990,1989,1988,1987,1986,1985,1984,1983,1982,1981,1980,1979,1978
This statistics in other country:
AfghanistanAlbaniaAlgeriaAngolaAntigua and BarbudaArab WorldArgentinaArmeniaArubaAustraliaAustriaAzerbaijanBahamas, TheBahrainBangladeshBarbadosBelarusBelgiumBelizeBeninBermudaBhutanBoliviaBosnia and HerzegovinaBotswanaBrazilBrunei DarussalamBulgariaBurkina FasoBurundiCabo VerdeCambodiaCameroonCanadaCaribbean small statesCentral African RepublicCentral Europe and the BalticsChadChileChinaColombiaComorosCongo, Dem. Rep.Congo, Rep.Costa RicaCote d'IvoireCroatiaCubaCyprusCzech RepublicDenmarkDjiboutiDominicaDominican RepublicEarly-demographic dividendEast Asia & PacificEast Asia & Pacific (excluding high income)East Asia & Pacific (IDA & IBRD countries)EcuadorEgypt, Arab Rep.El SalvadorEquatorial GuineaEritreaEstoniaEthiopiaEuro areaEurope & Central AsiaEurope & Central Asia (excluding high income)Europe & Central Asia (IDA & IBRD countries)European UnionFaroe IslandsFijiFinlandFragile and conflict affected situationsFranceFrench PolynesiaGabonGambia, TheGeorgiaGermanyGhanaGreeceGrenadaGuatemalaGuineaGuinea-BissauGuyanaHaitiHeavily indebted poor countries (HIPC)High incomeHondurasHong Kong SAR, ChinaHungaryIBRD onlyIcelandIDA & IBRD totalIDA blendIDA onlyIDA totalIndiaIndonesiaIran, Islamic Rep.IraqIrelandIsraelItalyJamaicaJapanJordanKazakhstanKenyaKiribatiKorea, Rep.KosovoKuwaitKyrgyz RepublicLao PDRLate-demographic dividendLatin America & Caribbean Latin America & Caribbean (excluding high income)Latin America & the Caribbean (IDA & IBRD countries)LatviaLeast developed countries: UN classificationLebanonLesothoLiberiaLibyaLithuaniaLow & middle incomeLow incomeLower middle incomeLuxembourgMacao SAR, ChinaMacedonia, FYRMadagascarMalawiMalaysiaMaldivesMaliMaltaMauritaniaMauritiusMexicoMicronesia, Fed. Sts.Middle East & North AfricaMiddle East & North Africa (excluding high income)Middle East & North Africa (IDA & IBRD countries)Middle incomeMoldovaMongoliaMontenegroMoroccoMozambiqueNamibiaNepalNetherlandsNew CaledoniaNew ZealandNicaraguaNigerNigeriaNorth AmericaNorwayOECD membersOmanOther small statesPakistanPanamaPapua New GuineaParaguayPeruPhilippinesPolandPortugalPost-demographic dividendPre-demographic dividendPuerto RicoQatarRomaniaRussian FederationRwandaSaudi ArabiaSenegalSerbiaSeychellesSierra LeoneSingaporeSlovak RepublicSloveniaSmall statesSolomon IslandsSomaliaSouth AfricaSouth AsiaSouth Asia (IDA & IBRD)South SudanSpainSri LankaSt. Kitts and NevisSt. LuciaSt. Vincent and the GrenadinesSub-Saharan Africa Sub-Saharan Africa (excluding high income)Sub-Saharan Africa (IDA & IBRD countries)SudanSurinameSwazilandSwedenSwitzerlandSyrian Arab RepublicTajikistanTanzaniaThailandTimor-LesteTogoTongaTrinidad and TobagoTunisiaTurkeyTurkmenistanUgandaUkraineUnited Arab EmiratesUnited KingdomUnited StatesUpper middle incomeUruguayUzbekistanVanuatuVenezuela, RBVietnamWest Bank and GazaWorldYemen, Rep.ZambiaZimbabwe Timeline:
This timeline shows a graph from 1978 to 2016 of Dominica. No data until 1977. Number of actual observations by date: 39.
Source name:
World Development Indicators
Source organization:
World Bank national accounts data, and OECD National Accounts data files.
Categories, topics:
Economy & Growth
Last updated:
apr 23, 2017
Indicators value changes by year
Minimum:
7.011 mln
jan 1, 1978
Maximum:
115.443 mln
jan 1, 2016
At the date of observation
Value
Absolute change
Change from previous value
jan 1, 1978
7.011 mln
+7.011 mln
0.0%
jan 1, 1979
9.307 mln
+2.296 mln
32.75%
jan 1, 1980
15.011 mln
+5.704 mln
61.28%
jan 1, 1981
16.126 mln
+1.115 mln
7.43%
jan 1, 1982
16.841 mln
+714.815K
4.43%
jan 1, 1983
17.685 mln
+844.444K
5.01%
jan 1, 1984
19.359 mln
+1.674 mln
9.47%
jan 1, 1985
22.307 mln
+2.948 mln
15.23%
jan 1, 1986
22.181 mln
-125.926K
-0.56%
jan 1, 1987
22.989 mln
+807.407K
3.64%
jan 1, 1988
25.241 mln
+2.252 mln
9.8%
jan 1, 1989
27.789 mln
+2.548 mln
10.1%
jan 1, 1990
32.115 mln
+4.326 mln
15.57%
jan 1, 1991
34.022 mln
+1.907 mln
5.94%
jan 1, 1992
37.963 mln
+3.941 mln
11.58%
jan 1, 1993
38.222 mln
+259.259K
0.68%
jan 1, 1994
41.567 mln
+3.344 mln
8.75%
jan 1, 1995
43.489 mln
+1.922 mln
4.62%
jan 1, 1996
45.611 mln
+2.122 mln
4.88%
jan 1, 1997
47.741 mln
+2.13 mln
4.67%
jan 1, 1998
53.011 mln
+5.27 mln
11.04%
jan 1, 1999
56.648 mln
+3.637 mln
6.86%
jan 1, 2000
58.985 mln
+2.337 mln
4.13%
jan 1, 2001
62.646 mln
+3.661 mln
6.21%
jan 1, 2002
60.946 mln
-1.701 mln
-2.71%
jan 1, 2003
56.068 mln
-4.877 mln
-8.0%
jan 1, 2004
51.342 mln
-4.727 mln
-8.43%
jan 1, 2005
52.733 mln
+1.391 mln
2.71%
jan 1, 2006
57.407 mln
+4.674 mln
8.86%
jan 1, 2007
61.111 mln
+3.704 mln
6.45%
jan 1, 2008
68.5 mln
+7.389 mln
12.09%
jan 1, 2009
66.981 mln
-1.519 mln
-2.22%
jan 1, 2010
84.089 mln
+17.107 mln
25.54%
jan 1, 2011
82.611 mln
-1.478 mln
-1.76%
jan 1, 2012
87.008 mln
+4.397 mln
5.32%
jan 1, 2013
89.642 mln
+2.633 mln
3.03%
jan 1, 2014
98.955 mln
+9.313 mln
10.39%
jan 1, 2015
106.515 mln
+7.56 mln
7.64%
jan 1, 2016
115.443 mln
+8.928 mln
8.38%
Ranking of countries by current statistics by years


Comments: