29
/
en
AIzaSyAYiBZKx7MnpbEhh9jyipgxe19OcubqV5w
April 1, 2024
47141
Lower middle income
LMC
false
2
1
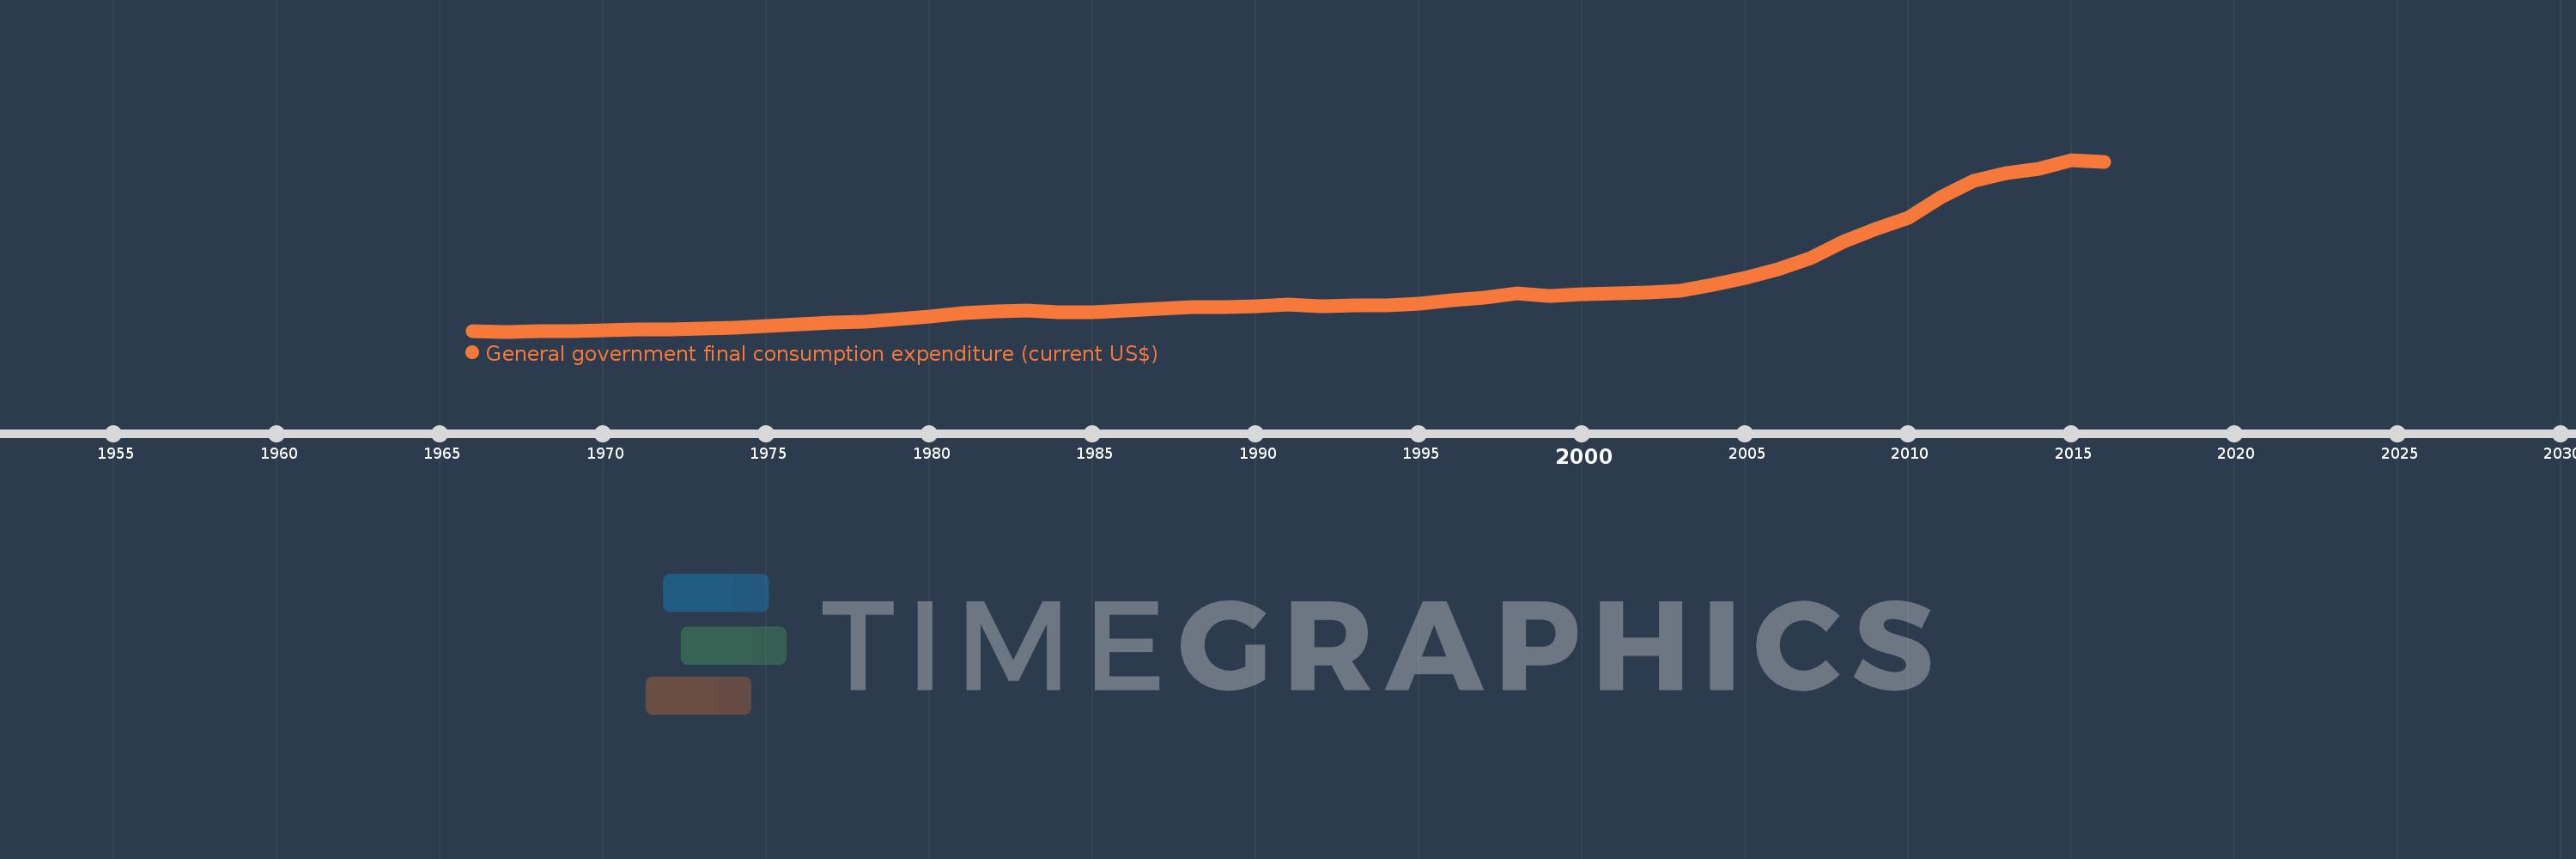
General government final consumption expenditure (current US$)
2016,2015,2014,2013,2012,2011,2010,2009,2008,2007,2006,2005,2004,2003,2002,2001,2000,1999,1998,1997,1996,1995,1994,1993,1992,1991,1990,1989,1988,1987,1986,1985,1984,1983,1982,1981,1980,1979,1978,1977,1976,1975,1974,1973,1972,1971,1970,1969,1968,1967,1966
This statistics in other country:
AfghanistanAlbaniaAlgeriaAngolaAntigua and BarbudaArab WorldArgentinaArmeniaArubaAustraliaAustriaAzerbaijanBahamas, TheBahrainBangladeshBarbadosBelarusBelgiumBelizeBeninBermudaBhutanBoliviaBosnia and HerzegovinaBotswanaBrazilBrunei DarussalamBulgariaBurkina FasoBurundiCabo VerdeCambodiaCameroonCanadaCaribbean small statesCentral African RepublicCentral Europe and the BalticsChadChileChinaColombiaComorosCongo, Dem. Rep.Congo, Rep.Costa RicaCote d'IvoireCroatiaCubaCyprusCzech RepublicDenmarkDjiboutiDominicaDominican RepublicEarly-demographic dividendEast Asia & PacificEast Asia & Pacific (excluding high income)East Asia & Pacific (IDA & IBRD countries)EcuadorEgypt, Arab Rep.El SalvadorEquatorial GuineaEritreaEstoniaEthiopiaEuro areaEurope & Central AsiaEurope & Central Asia (excluding high income)Europe & Central Asia (IDA & IBRD countries)European UnionFaroe IslandsFijiFinlandFragile and conflict affected situationsFranceFrench PolynesiaGabonGambia, TheGeorgiaGermanyGhanaGreeceGrenadaGuatemalaGuineaGuinea-BissauGuyanaHaitiHeavily indebted poor countries (HIPC)High incomeHondurasHong Kong SAR, ChinaHungaryIBRD onlyIcelandIDA & IBRD totalIDA blendIDA onlyIDA totalIndiaIndonesiaIran, Islamic Rep.IraqIrelandIsraelItalyJamaicaJapanJordanKazakhstanKenyaKiribatiKorea, Rep.KosovoKuwaitKyrgyz RepublicLao PDRLate-demographic dividendLatin America & Caribbean Latin America & Caribbean (excluding high income)Latin America & the Caribbean (IDA & IBRD countries)LatviaLeast developed countries: UN classificationLebanonLesothoLiberiaLibyaLithuaniaLow & middle incomeLow incomeLower middle incomeLuxembourgMacao SAR, ChinaMacedonia, FYRMadagascarMalawiMalaysiaMaldivesMaliMaltaMauritaniaMauritiusMexicoMicronesia, Fed. Sts.Middle East & North AfricaMiddle East & North Africa (excluding high income)Middle East & North Africa (IDA & IBRD countries)Middle incomeMoldovaMongoliaMontenegroMoroccoMozambiqueNamibiaNepalNetherlandsNew CaledoniaNew ZealandNicaraguaNigerNigeriaNorth AmericaNorwayOECD membersOmanOther small statesPakistanPanamaPapua New GuineaParaguayPeruPhilippinesPolandPortugalPost-demographic dividendPre-demographic dividendPuerto RicoQatarRomaniaRussian FederationRwandaSaudi ArabiaSenegalSerbiaSeychellesSierra LeoneSingaporeSlovak RepublicSloveniaSmall statesSolomon IslandsSomaliaSouth AfricaSouth AsiaSouth Asia (IDA & IBRD)South SudanSpainSri LankaSt. Kitts and NevisSt. LuciaSt. Vincent and the GrenadinesSub-Saharan Africa Sub-Saharan Africa (excluding high income)Sub-Saharan Africa (IDA & IBRD countries)SudanSurinameSwazilandSwedenSwitzerlandSyrian Arab RepublicTajikistanTanzaniaThailandTimor-LesteTogoTongaTrinidad and TobagoTunisiaTurkeyTurkmenistanUgandaUkraineUnited Arab EmiratesUnited KingdomUnited StatesUpper middle incomeUruguayUzbekistanVanuatuVenezuela, RBVietnamWest Bank and GazaWorldYemen, Rep.ZambiaZimbabwe Timeline:
This timeline shows a graph from 1966 to 2016 of Lower middle income. No data until 1965. Number of actual observations by date: 51.
Source name:
World Development Indicators
Source organization:
World Bank national accounts data, and OECD National Accounts data files.
Categories, topics:
Economy & Growth
Last updated:
apr 23, 2017
Indicators value changes by year
Minimum:
14.269 bln
jan 1, 1967
Maximum:
625.661 bln
jan 1, 2015
At the date of observation
Value
Absolute change
Change from previous value
jan 1, 1966
15.274 bln
+15.274 bln
0.0%
jan 1, 1967
14.269 bln
-1.004 bln
-6.57%
jan 1, 1968
15.037 bln
+768.141 mln
5.38%
jan 1, 1969
16.737 bln
+1.699 bln
11.3%
jan 1, 1970
18.786 bln
+2.049 bln
12.24%
jan 1, 1971
20.619 bln
+1.833 bln
9.76%
jan 1, 1972
23.389 bln
+2.77 bln
13.43%
jan 1, 1973
25.057 bln
+1.668 bln
7.13%
jan 1, 1974
28.207 bln
+3.15 bln
12.57%
jan 1, 1975
32.645 bln
+4.438 bln
15.73%
jan 1, 1976
40.198 bln
+7.553 bln
23.14%
jan 1, 1977
45.523 bln
+5.325 bln
13.25%
jan 1, 1978
50.646 bln
+5.123 bln
11.25%
jan 1, 1979
59.017 bln
+8.37 bln
16.53%
jan 1, 1980
66.587 bln
+7.571 bln
12.83%
jan 1, 1981
81.005 bln
+14.418 bln
21.65%
jan 1, 1982
86.118 bln
+5.113 bln
6.31%
jan 1, 1983
88.474 bln
+2.355 bln
2.74%
jan 1, 1984
84.051 bln
-4.423 bln
-5.0%
jan 1, 1985
83.695 bln
-355.714 mln
-0.42%
jan 1, 1986
90.629 bln
+6.934 bln
8.28%
jan 1, 1987
95.569 bln
+4.94 bln
5.45%
jan 1, 1988
101.258 bln
+5.69 bln
5.95%
jan 1, 1989
102.547 bln
+1.289 bln
1.27%
jan 1, 1990
105.129 bln
+2.581 bln
2.52%
jan 1, 1991
110.119 bln
+4.99 bln
4.75%
jan 1, 1992
102.933 bln
-7.186 bln
-6.53%
jan 1, 1993
109.002 bln
+6.069 bln
5.9%
jan 1, 1994
108.836 bln
-166.64 mln
-0.15%
jan 1, 1995
114.633 bln
+5.797 bln
5.33%
jan 1, 1996
127.146 bln
+12.513 bln
10.92%
jan 1, 1997
136.283 bln
+9.137 bln
7.19%
jan 1, 1998
149.091 bln
+12.808 bln
9.4%
jan 1, 1999
140.399 bln
-8.692 bln
-5.83%
jan 1, 2000
146.349 bln
+5.949 bln
4.24%
jan 1, 2001
149.727 bln
+3.379 bln
2.31%
jan 1, 2002
151.981 bln
+2.253 bln
1.5%
jan 1, 2003
160.427 bln
+8.446 bln
5.56%
jan 1, 2004
182.237 bln
+21.811 bln
13.6%
jan 1, 2005
205.774 bln
+23.537 bln
12.92%
jan 1, 2006
234.442 bln
+28.667 bln
13.93%
jan 1, 2007
274.639 bln
+40.197 bln
17.15%
jan 1, 2008
334.009 bln
+59.37 bln
21.62%
jan 1, 2009
378.942 bln
+44.933 bln
13.45%
jan 1, 2010
418.549 bln
+39.607 bln
10.45%
jan 1, 2011
491.23 bln
+72.681 bln
17.36%
jan 1, 2012
550.97 bln
+59.74 bln
12.16%
jan 1, 2013
577.756 bln
+26.786 bln
4.86%
jan 1, 2014
592.654 bln
+14.898 bln
2.58%
jan 1, 2015
625.661 bln
+33.006 bln
5.57%
jan 1, 2016
618.83 bln
-6.831 bln
-1.09%
Ranking of countries by current statistics by years


Comments: