29
/
en
AIzaSyAYiBZKx7MnpbEhh9jyipgxe19OcubqV5w
April 1, 2024
226764
Puerto Rico
PRI
true
2
1
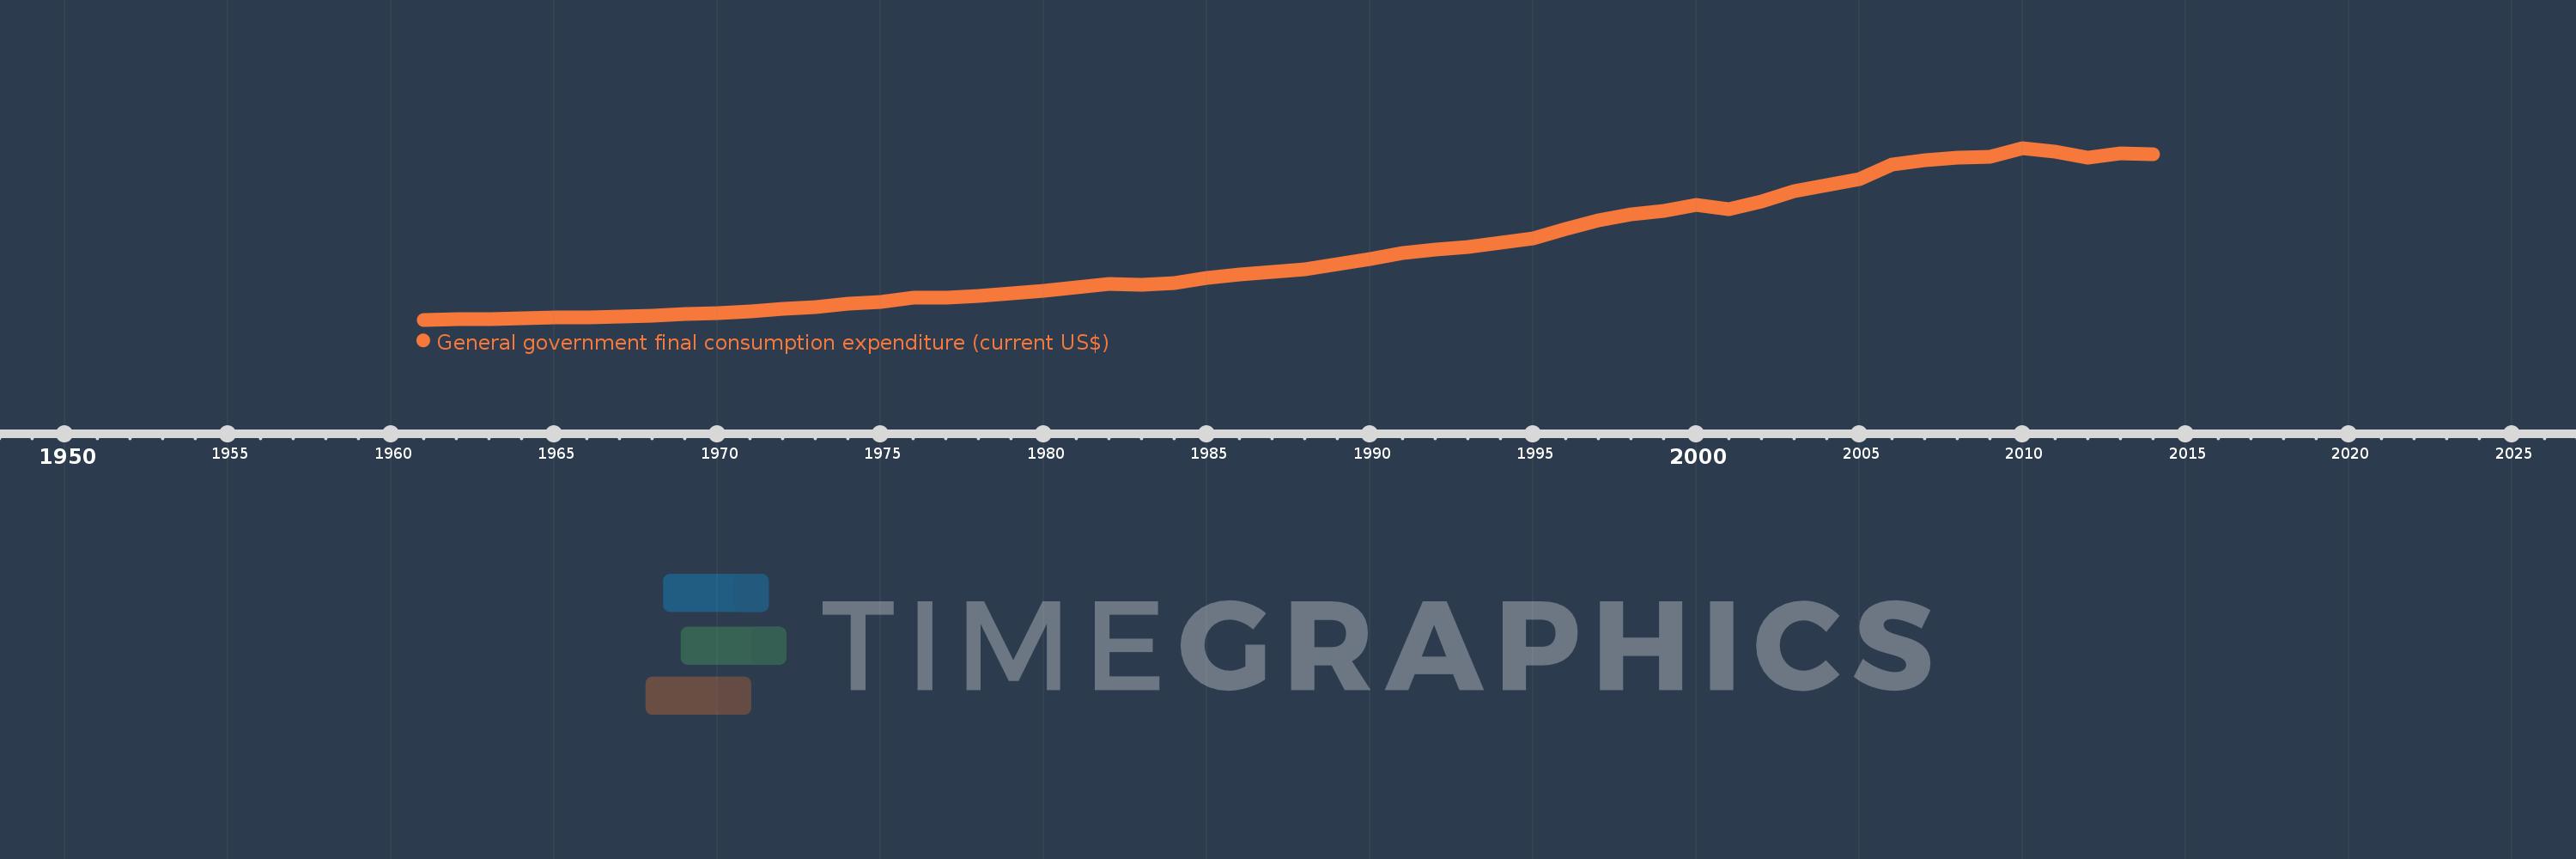
General government final consumption expenditure (current US$)
2014,2013,2012,2011,2010,2009,2008,2007,2006,2005,2004,2003,2002,2001,2000,1999,1998,1997,1996,1995,1994,1993,1992,1991,1990,1989,1988,1987,1986,1985,1984,1983,1982,1981,1980,1979,1978,1977,1976,1975,1974,1973,1972,1971,1970,1969,1968,1967,1966,1965,1964,1963,1962,1961
This statistics in other country:
AfghanistanAlbaniaAlgeriaAngolaAntigua and BarbudaArab WorldArgentinaArmeniaArubaAustraliaAustriaAzerbaijanBahamas, TheBahrainBangladeshBarbadosBelarusBelgiumBelizeBeninBermudaBhutanBoliviaBosnia and HerzegovinaBotswanaBrazilBrunei DarussalamBulgariaBurkina FasoBurundiCabo VerdeCambodiaCameroonCanadaCaribbean small statesCentral African RepublicCentral Europe and the BalticsChadChileChinaColombiaComorosCongo, Dem. Rep.Congo, Rep.Costa RicaCote d'IvoireCroatiaCubaCyprusCzech RepublicDenmarkDjiboutiDominicaDominican RepublicEarly-demographic dividendEast Asia & PacificEast Asia & Pacific (excluding high income)East Asia & Pacific (IDA & IBRD countries)EcuadorEgypt, Arab Rep.El SalvadorEquatorial GuineaEritreaEstoniaEthiopiaEuro areaEurope & Central AsiaEurope & Central Asia (excluding high income)Europe & Central Asia (IDA & IBRD countries)European UnionFaroe IslandsFijiFinlandFragile and conflict affected situationsFranceFrench PolynesiaGabonGambia, TheGeorgiaGermanyGhanaGreeceGrenadaGuatemalaGuineaGuinea-BissauGuyanaHaitiHeavily indebted poor countries (HIPC)High incomeHondurasHong Kong SAR, ChinaHungaryIBRD onlyIcelandIDA & IBRD totalIDA blendIDA onlyIDA totalIndiaIndonesiaIran, Islamic Rep.IraqIrelandIsraelItalyJamaicaJapanJordanKazakhstanKenyaKiribatiKorea, Rep.KosovoKuwaitKyrgyz RepublicLao PDRLate-demographic dividendLatin America & Caribbean Latin America & Caribbean (excluding high income)Latin America & the Caribbean (IDA & IBRD countries)LatviaLeast developed countries: UN classificationLebanonLesothoLiberiaLibyaLithuaniaLow & middle incomeLow incomeLower middle incomeLuxembourgMacao SAR, ChinaMacedonia, FYRMadagascarMalawiMalaysiaMaldivesMaliMaltaMauritaniaMauritiusMexicoMicronesia, Fed. Sts.Middle East & North AfricaMiddle East & North Africa (excluding high income)Middle East & North Africa (IDA & IBRD countries)Middle incomeMoldovaMongoliaMontenegroMoroccoMozambiqueNamibiaNepalNetherlandsNew CaledoniaNew ZealandNicaraguaNigerNigeriaNorth AmericaNorwayOECD membersOmanOther small statesPakistanPanamaPapua New GuineaParaguayPeruPhilippinesPolandPortugalPost-demographic dividendPre-demographic dividendPuerto RicoQatarRomaniaRussian FederationRwandaSaudi ArabiaSenegalSerbiaSeychellesSierra LeoneSingaporeSlovak RepublicSloveniaSmall statesSolomon IslandsSomaliaSouth AfricaSouth AsiaSouth Asia (IDA & IBRD)South SudanSpainSri LankaSt. Kitts and NevisSt. LuciaSt. Vincent and the GrenadinesSub-Saharan Africa Sub-Saharan Africa (excluding high income)Sub-Saharan Africa (IDA & IBRD countries)SudanSurinameSwazilandSwedenSwitzerlandSyrian Arab RepublicTajikistanTanzaniaThailandTimor-LesteTogoTongaTrinidad and TobagoTunisiaTurkeyTurkmenistanUgandaUkraineUnited Arab EmiratesUnited KingdomUnited StatesUpper middle incomeUruguayUzbekistanVanuatuVenezuela, RBVietnamWest Bank and GazaWorldYemen, Rep.ZambiaZimbabwe Timeline:
This timeline shows a graph from 1961 to 2014 of Puerto Rico. No data until 1960. Number of actual observations by date: 54.
Source name:
World Development Indicators
Source organization:
World Bank national accounts data, and OECD National Accounts data files.
Categories, topics:
Economy & Growth
Last updated:
apr 23, 2017
Indicators value changes by year
Minimum:
217.9 mln
jan 1, 1961
Maximum:
11.102 bln
jan 1, 2010
At the date of observation
Value
Absolute change
Change from previous value
jan 1, 1961
217.9 mln
+217.9 mln
0.0%
jan 1, 1962
250.2 mln
+32.3 mln
14.82%
jan 1, 1963
275.1 mln
+24.9 mln
9.95%
jan 1, 1964
301.4 mln
+26.3 mln
9.56%
jan 1, 1965
342.3 mln
+40.9 mln
13.57%
jan 1, 1966
380.1 mln
+37.8 mln
11.04%
jan 1, 1967
403.7 mln
+23.6 mln
6.21%
jan 1, 1968
481.0 mln
+77.3 mln
19.15%
jan 1, 1969
566.8 mln
+85.8 mln
17.84%
jan 1, 1970
627.8 mln
+61.0 mln
10.76%
jan 1, 1971
764.8 mln
+137.0 mln
21.82%
jan 1, 1972
913.8 mln
+149.0 mln
19.48%
jan 1, 1973
1.04 bln
+126.7 mln
13.87%
jan 1, 1974
1.231 bln
+190.8 mln
18.34%
jan 1, 1975
1.326 bln
+94.4 mln
7.67%
jan 1, 1976
1.614 bln
+288.2 mln
21.74%
jan 1, 1977
1.613 bln
-1000.0K
-0.06%
jan 1, 1978
1.729 bln
+116.0 mln
7.19%
jan 1, 1979
1.867 bln
+138.5 mln
8.01%
jan 1, 1980
2.055 bln
+187.9 mln
10.06%
jan 1, 1981
2.282 bln
+226.3 mln
11.01%
jan 1, 1982
2.505 bln
+223.4 mln
9.79%
jan 1, 1983
2.42 bln
-85.4 mln
-3.41%
jan 1, 1984
2.567 bln
+147.1 mln
6.08%
jan 1, 1985
2.888 bln
+320.9 mln
12.5%
jan 1, 1986
3.065 bln
+177.6 mln
6.15%
jan 1, 1987
3.235 bln
+169.9 mln
5.54%
jan 1, 1988
3.438 bln
+202.9 mln
6.27%
jan 1, 1989
3.716 bln
+277.8 mln
8.08%
jan 1, 1990
4.079 bln
+363.6 mln
9.79%
jan 1, 1991
4.431 bln
+351.7 mln
8.62%
jan 1, 1992
4.641 bln
+209.6 mln
4.73%
jan 1, 1993
4.805 bln
+164.5 mln
3.54%
jan 1, 1994
5.087 bln
+282.2 mln
5.87%
jan 1, 1995
5.357 bln
+270.0 mln
5.31%
jan 1, 1996
5.946 bln
+588.6 mln
10.99%
jan 1, 1997
6.493 bln
+547.353 mln
9.21%
jan 1, 1998
6.913 bln
+419.495 mln
6.46%
jan 1, 1999
7.099 bln
+186.042 mln
2.69%
jan 1, 2000
7.505 bln
+406.177 mln
5.72%
jan 1, 2001
7.229 bln
-275.665 mln
-3.67%
jan 1, 2002
7.722 bln
+492.61 mln
6.81%
jan 1, 2003
8.356 bln
+634.102 mln
8.21%
jan 1, 2004
8.733 bln
+377.378 mln
4.52%
jan 1, 2005
9.101 bln
+367.354 mln
4.21%
jan 1, 2006
10.065 bln
+964.599 mln
10.6%
jan 1, 2007
10.33 bln
+264.157 mln
2.62%
jan 1, 2008
10.512 bln
+182.804 mln
1.77%
jan 1, 2009
10.518 bln
+5.715 mln
0.05%
jan 1, 2010
11.102 bln
+583.577 mln
5.55%
jan 1, 2011
10.842 bln
-259.762 mln
-2.34%
jan 1, 2012
10.507 bln
-335.338 mln
-3.09%
jan 1, 2013
10.785 bln
+278.07 mln
2.65%
jan 1, 2014
10.716 bln
-68.657 mln
-0.64%
Ranking of countries by current statistics by years


Comments: