29
/
en
AIzaSyAYiBZKx7MnpbEhh9jyipgxe19OcubqV5w
April 1, 2024
159424
Ireland
IRL
true
2
1
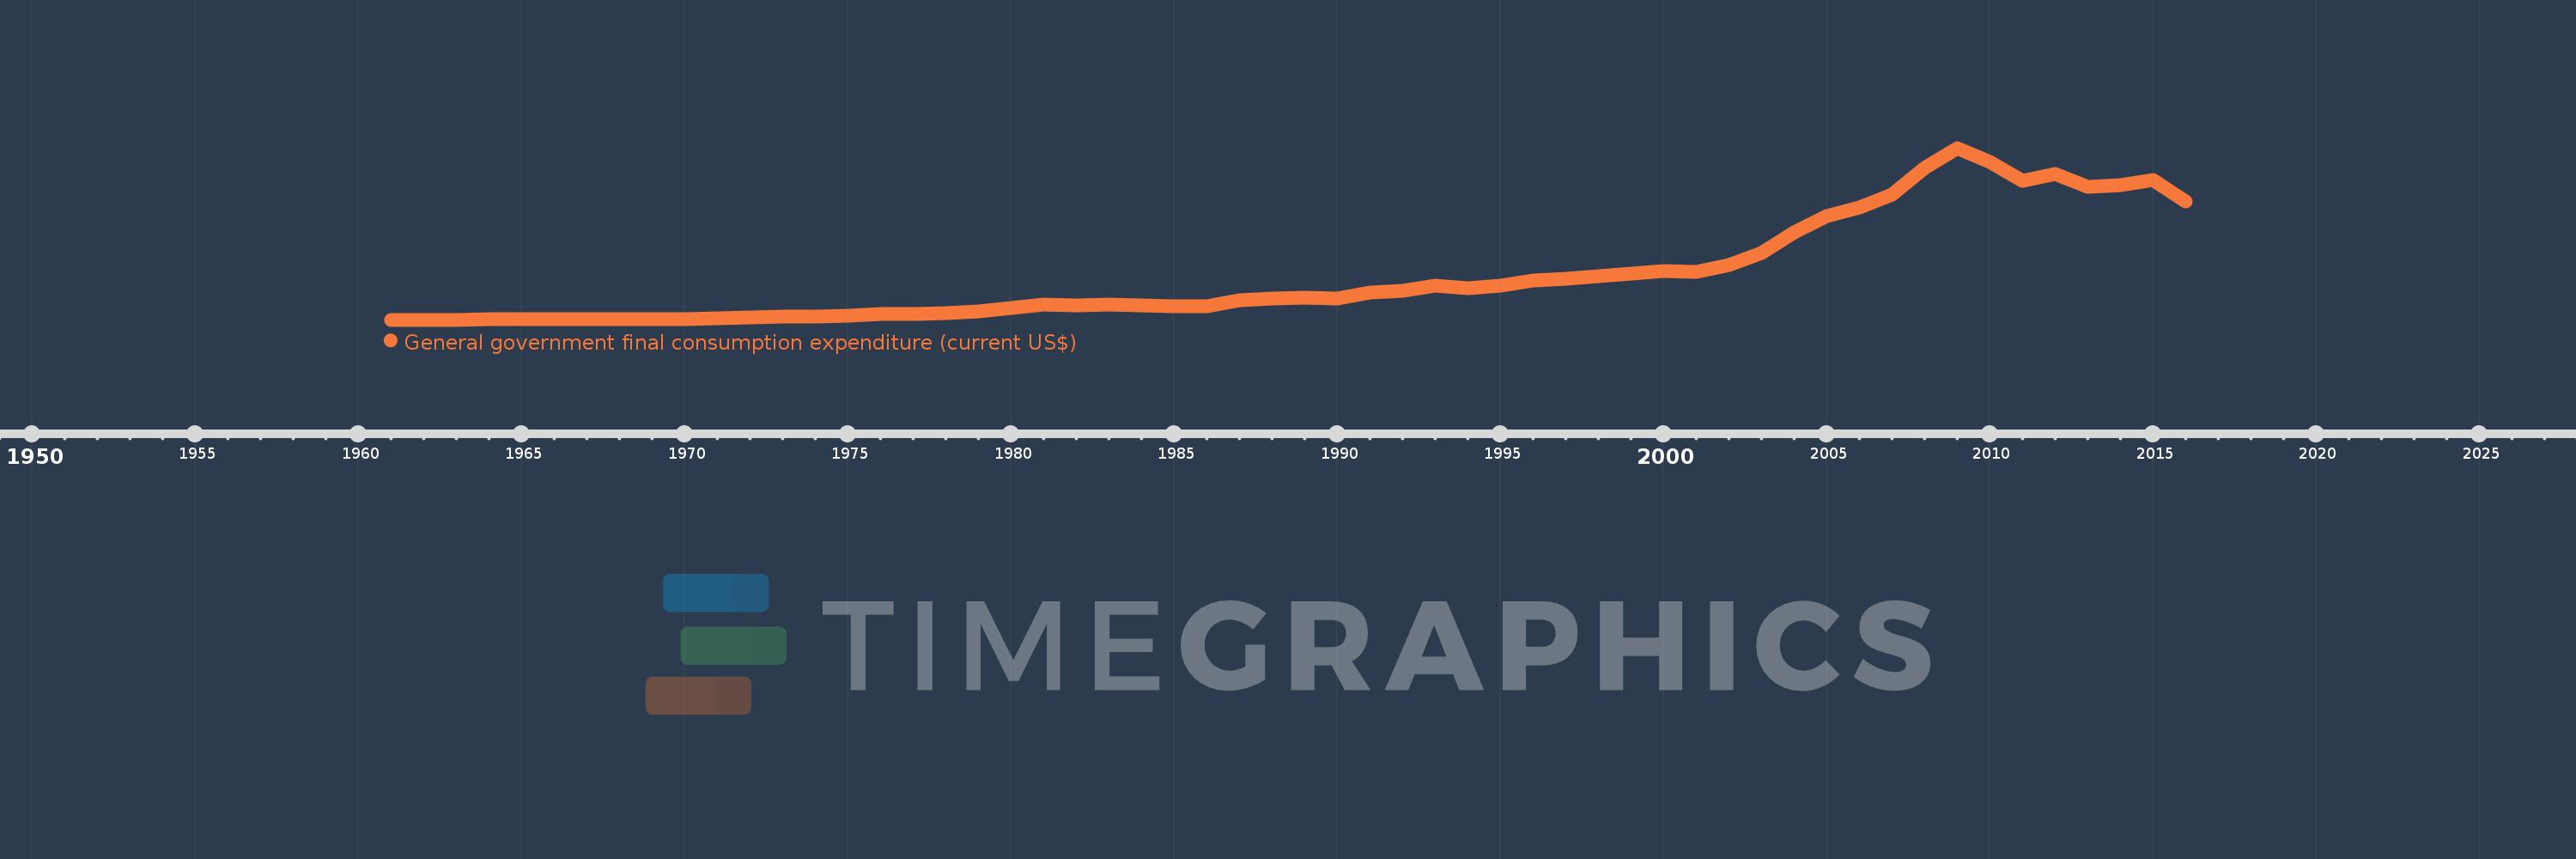
General government final consumption expenditure (current US$)
2016,2015,2014,2013,2012,2011,2010,2009,2008,2007,2006,2005,2004,2003,2002,2001,2000,1999,1998,1997,1996,1995,1994,1993,1992,1991,1990,1989,1988,1987,1986,1985,1984,1983,1982,1981,1980,1979,1978,1977,1976,1975,1974,1973,1972,1971,1970,1969,1968,1967,1966,1965,1964,1963,1962,1961
This statistics in other country:
AfghanistanAlbaniaAlgeriaAngolaAntigua and BarbudaArab WorldArgentinaArmeniaArubaAustraliaAustriaAzerbaijanBahamas, TheBahrainBangladeshBarbadosBelarusBelgiumBelizeBeninBermudaBhutanBoliviaBosnia and HerzegovinaBotswanaBrazilBrunei DarussalamBulgariaBurkina FasoBurundiCabo VerdeCambodiaCameroonCanadaCaribbean small statesCentral African RepublicCentral Europe and the BalticsChadChileChinaColombiaComorosCongo, Dem. Rep.Congo, Rep.Costa RicaCote d'IvoireCroatiaCubaCyprusCzech RepublicDenmarkDjiboutiDominicaDominican RepublicEarly-demographic dividendEast Asia & PacificEast Asia & Pacific (excluding high income)East Asia & Pacific (IDA & IBRD countries)EcuadorEgypt, Arab Rep.El SalvadorEquatorial GuineaEritreaEstoniaEthiopiaEuro areaEurope & Central AsiaEurope & Central Asia (excluding high income)Europe & Central Asia (IDA & IBRD countries)European UnionFaroe IslandsFijiFinlandFragile and conflict affected situationsFranceFrench PolynesiaGabonGambia, TheGeorgiaGermanyGhanaGreeceGrenadaGuatemalaGuineaGuinea-BissauGuyanaHaitiHeavily indebted poor countries (HIPC)High incomeHondurasHong Kong SAR, ChinaHungaryIBRD onlyIcelandIDA & IBRD totalIDA blendIDA onlyIDA totalIndiaIndonesiaIran, Islamic Rep.IraqIrelandIsraelItalyJamaicaJapanJordanKazakhstanKenyaKiribatiKorea, Rep.KosovoKuwaitKyrgyz RepublicLao PDRLate-demographic dividendLatin America & Caribbean Latin America & Caribbean (excluding high income)Latin America & the Caribbean (IDA & IBRD countries)LatviaLeast developed countries: UN classificationLebanonLesothoLiberiaLibyaLithuaniaLow & middle incomeLow incomeLower middle incomeLuxembourgMacao SAR, ChinaMacedonia, FYRMadagascarMalawiMalaysiaMaldivesMaliMaltaMauritaniaMauritiusMexicoMicronesia, Fed. Sts.Middle East & North AfricaMiddle East & North Africa (excluding high income)Middle East & North Africa (IDA & IBRD countries)Middle incomeMoldovaMongoliaMontenegroMoroccoMozambiqueNamibiaNepalNetherlandsNew CaledoniaNew ZealandNicaraguaNigerNigeriaNorth AmericaNorwayOECD membersOmanOther small statesPakistanPanamaPapua New GuineaParaguayPeruPhilippinesPolandPortugalPost-demographic dividendPre-demographic dividendPuerto RicoQatarRomaniaRussian FederationRwandaSaudi ArabiaSenegalSerbiaSeychellesSierra LeoneSingaporeSlovak RepublicSloveniaSmall statesSolomon IslandsSomaliaSouth AfricaSouth AsiaSouth Asia (IDA & IBRD)South SudanSpainSri LankaSt. Kitts and NevisSt. LuciaSt. Vincent and the GrenadinesSub-Saharan Africa Sub-Saharan Africa (excluding high income)Sub-Saharan Africa (IDA & IBRD countries)SudanSurinameSwazilandSwedenSwitzerlandSyrian Arab RepublicTajikistanTanzaniaThailandTimor-LesteTogoTongaTrinidad and TobagoTunisiaTurkeyTurkmenistanUgandaUkraineUnited Arab EmiratesUnited KingdomUnited StatesUpper middle incomeUruguayUzbekistanVanuatuVenezuela, RBVietnamWest Bank and GazaWorldYemen, Rep.ZambiaZimbabwe Timeline:
This timeline shows a graph from 1961 to 2016 of Ireland. No data until 1960. Number of actual observations by date: 56.
Source name:
World Development Indicators
Source organization:
World Bank national accounts data, and OECD National Accounts data files.
Categories, topics:
Economy & Growth
Last updated:
apr 23, 2017
Indicators value changes by year
Minimum:
254.548 mln
jan 1, 1961
Maximum:
51.745 bln
jan 1, 2009
At the date of observation
Value
Absolute change
Change from previous value
jan 1, 1961
254.548 mln
+254.548 mln
0.0%
jan 1, 1962
273.656 mln
+19.107 mln
7.51%
jan 1, 1963
298.593 mln
+24.937 mln
9.11%
jan 1, 1964
324.825 mln
+26.232 mln
8.79%
jan 1, 1965
388.948 mln
+64.123 mln
19.74%
jan 1, 1966
422.304 mln
+33.357 mln
8.58%
jan 1, 1967
444.327 mln
+22.023 mln
5.21%
jan 1, 1968
470.819 mln
+26.492 mln
5.96%
jan 1, 1969
463.295 mln
-7.524 mln
-1.6%
jan 1, 1970
540.186 mln
+76.891 mln
16.6%
jan 1, 1971
717.964 mln
+177.778 mln
32.91%
jan 1, 1972
866.677 mln
+148.713 mln
20.71%
jan 1, 1973
1.08 bln
+213.342 mln
24.62%
jan 1, 1974
1.306 bln
+225.841 mln
20.91%
jan 1, 1975
1.512 bln
+206.534 mln
15.82%
jan 1, 1976
1.967 bln
+454.608 mln
30.06%
jan 1, 1977
1.902 bln
-65.319 mln
-3.32%
jan 1, 1978
2.14 bln
+237.95 mln
12.51%
jan 1, 1979
2.794 bln
+654.431 mln
30.59%
jan 1, 1980
3.693 bln
+899.126 mln
32.18%
jan 1, 1981
4.819 bln
+1.126 bln
30.49%
jan 1, 1982
4.587 bln
-232.745 mln
-4.83%
jan 1, 1983
4.735 bln
+148.623 mln
3.24%
jan 1, 1984
4.477 bln
-258.303 mln
-5.45%
jan 1, 1985
4.191 bln
-286.099 mln
-6.39%
jan 1, 1986
4.401 bln
+210.113 mln
5.01%
jan 1, 1987
6.009 bln
+1.608 bln
36.54%
jan 1, 1988
6.698 bln
+688.783 mln
11.46%
jan 1, 1989
6.798 bln
+100.338 mln
1.5%
jan 1, 1990
6.558 bln
-239.944 mln
-3.53%
jan 1, 1991
8.48 bln
+1.922 bln
29.31%
jan 1, 1992
9.059 bln
+578.146 mln
6.82%
jan 1, 1993
10.396 bln
+1.338 bln
14.77%
jan 1, 1994
9.637 bln
-758.934 mln
-7.3%
jan 1, 1995
10.395 bln
+758.164 mln
7.87%
jan 1, 1996
11.932 bln
+1.536 bln
14.78%
jan 1, 1997
12.587 bln
+655.621 mln
5.49%
jan 1, 1998
13.335 bln
+747.443 mln
5.94%
jan 1, 1999
13.96 bln
+625.475 mln
4.69%
jan 1, 2000
14.749 bln
+788.554 mln
5.65%
jan 1, 2001
14.652 bln
-96.712 mln
-0.66%
jan 1, 2002
16.757 bln
+2.105 bln
14.37%
jan 1, 2003
20.191 bln
+3.434 bln
20.49%
jan 1, 2004
26.338 bln
+6.147 bln
30.45%
jan 1, 2005
31.29 bln
+4.951 bln
18.8%
jan 1, 2006
33.955 bln
+2.666 bln
8.52%
jan 1, 2007
37.724 bln
+3.769 bln
11.1%
jan 1, 2008
45.665 bln
+7.941 bln
21.05%
jan 1, 2009
51.745 bln
+6.08 bln
13.31%
jan 1, 2010
47.608 bln
-4.137 bln
-8.0%
jan 1, 2011
41.837 bln
-5.77 bln
-12.12%
jan 1, 2012
43.902 bln
+2.065 bln
4.94%
jan 1, 2013
40.014 bln
-3.889 bln
-8.86%
jan 1, 2014
40.619 bln
+605.428 mln
1.51%
jan 1, 2015
42.023 bln
+1.403 bln
3.46%
jan 1, 2016
35.601 bln
-6.422 bln
-15.28%
Ranking of countries by current statistics by years


Comments: