29
/
en
AIzaSyAYiBZKx7MnpbEhh9jyipgxe19OcubqV5w
April 1, 2024
262258
Thailand
THA
true
2
1
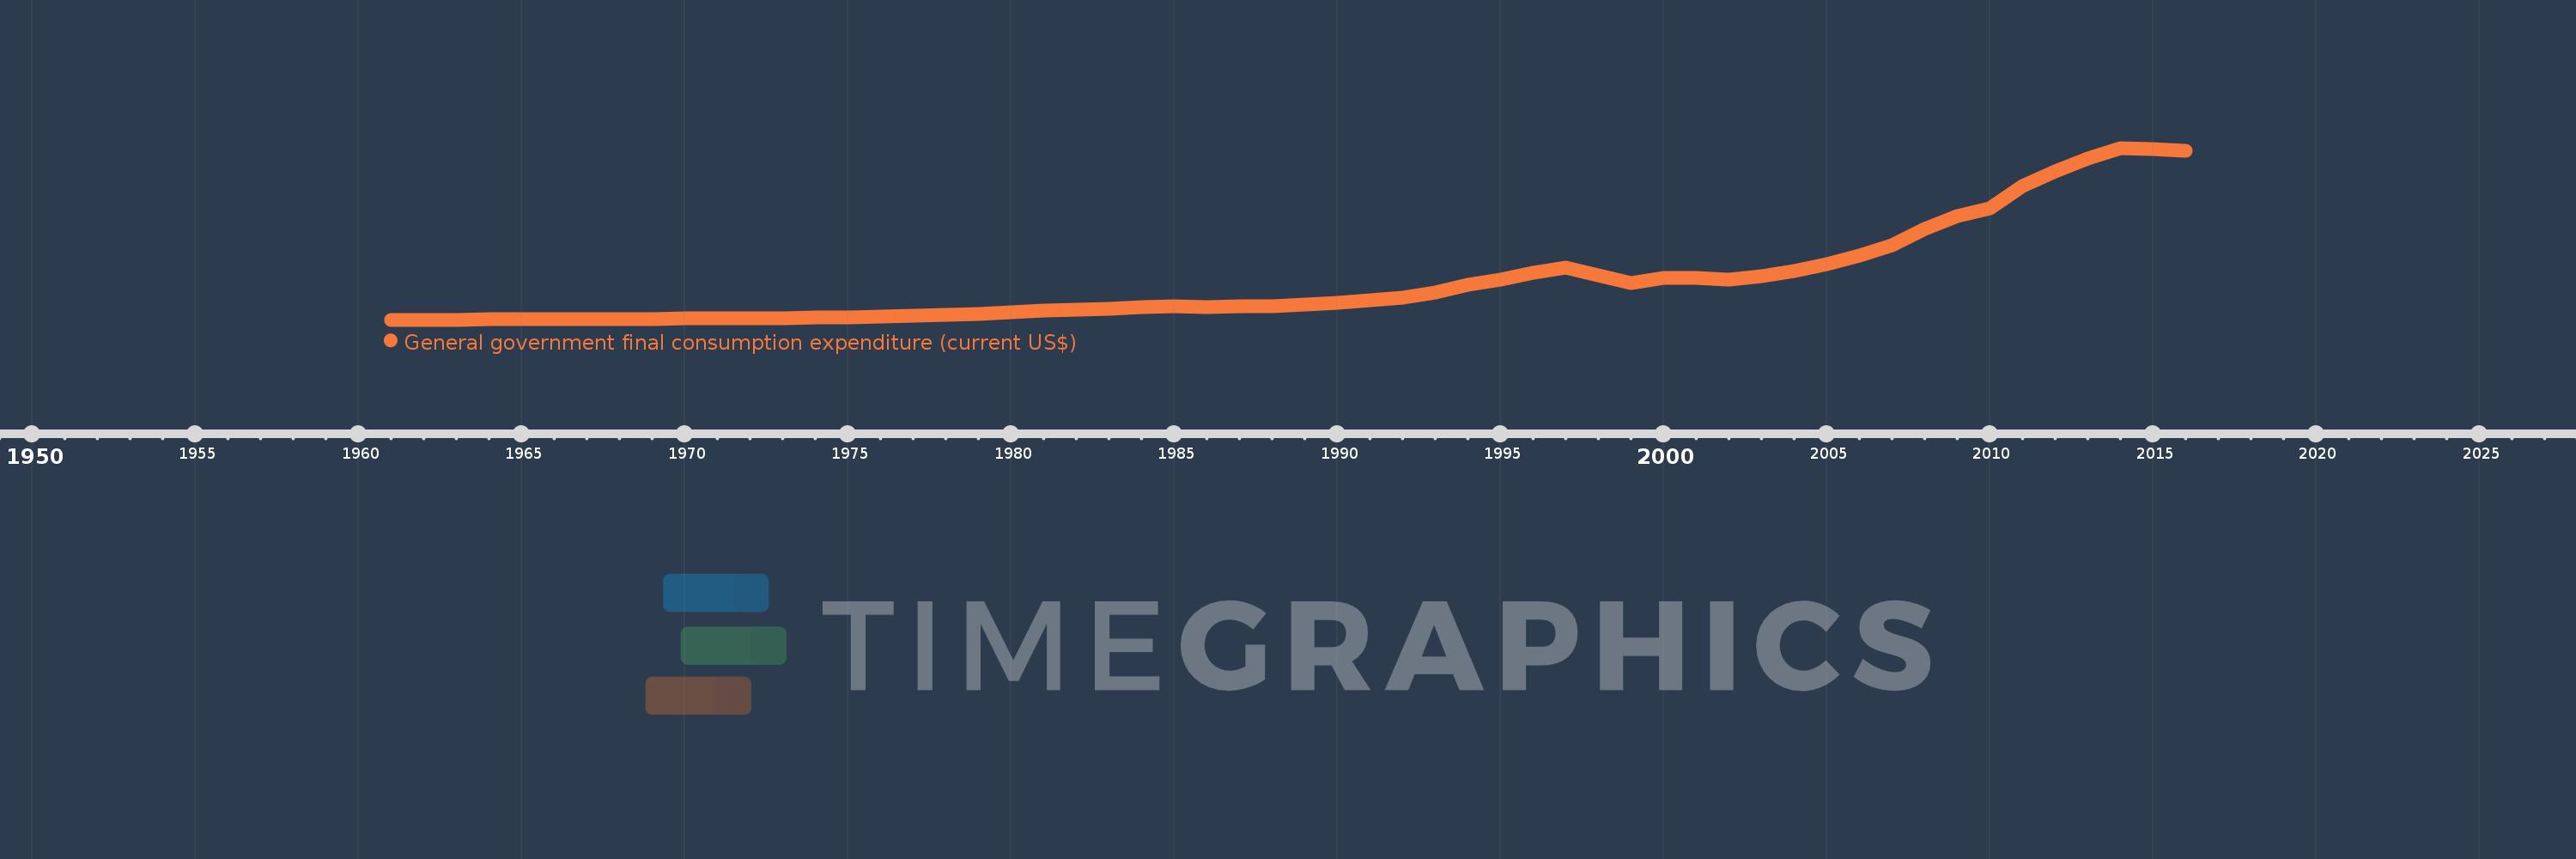
General government final consumption expenditure (current US$)
2016,2015,2014,2013,2012,2011,2010,2009,2008,2007,2006,2005,2004,2003,2002,2001,2000,1999,1998,1997,1996,1995,1994,1993,1992,1991,1990,1989,1988,1987,1986,1985,1984,1983,1982,1981,1980,1979,1978,1977,1976,1975,1974,1973,1972,1971,1970,1969,1968,1967,1966,1965,1964,1963,1962,1961
This statistics in other country:
AfghanistanAlbaniaAlgeriaAngolaAntigua and BarbudaArab WorldArgentinaArmeniaArubaAustraliaAustriaAzerbaijanBahamas, TheBahrainBangladeshBarbadosBelarusBelgiumBelizeBeninBermudaBhutanBoliviaBosnia and HerzegovinaBotswanaBrazilBrunei DarussalamBulgariaBurkina FasoBurundiCabo VerdeCambodiaCameroonCanadaCaribbean small statesCentral African RepublicCentral Europe and the BalticsChadChileChinaColombiaComorosCongo, Dem. Rep.Congo, Rep.Costa RicaCote d'IvoireCroatiaCubaCyprusCzech RepublicDenmarkDjiboutiDominicaDominican RepublicEarly-demographic dividendEast Asia & PacificEast Asia & Pacific (excluding high income)East Asia & Pacific (IDA & IBRD countries)EcuadorEgypt, Arab Rep.El SalvadorEquatorial GuineaEritreaEstoniaEthiopiaEuro areaEurope & Central AsiaEurope & Central Asia (excluding high income)Europe & Central Asia (IDA & IBRD countries)European UnionFaroe IslandsFijiFinlandFragile and conflict affected situationsFranceFrench PolynesiaGabonGambia, TheGeorgiaGermanyGhanaGreeceGrenadaGuatemalaGuineaGuinea-BissauGuyanaHaitiHeavily indebted poor countries (HIPC)High incomeHondurasHong Kong SAR, ChinaHungaryIBRD onlyIcelandIDA & IBRD totalIDA blendIDA onlyIDA totalIndiaIndonesiaIran, Islamic Rep.IraqIrelandIsraelItalyJamaicaJapanJordanKazakhstanKenyaKiribatiKorea, Rep.KosovoKuwaitKyrgyz RepublicLao PDRLate-demographic dividendLatin America & Caribbean Latin America & Caribbean (excluding high income)Latin America & the Caribbean (IDA & IBRD countries)LatviaLeast developed countries: UN classificationLebanonLesothoLiberiaLibyaLithuaniaLow & middle incomeLow incomeLower middle incomeLuxembourgMacao SAR, ChinaMacedonia, FYRMadagascarMalawiMalaysiaMaldivesMaliMaltaMauritaniaMauritiusMexicoMicronesia, Fed. Sts.Middle East & North AfricaMiddle East & North Africa (excluding high income)Middle East & North Africa (IDA & IBRD countries)Middle incomeMoldovaMongoliaMontenegroMoroccoMozambiqueNamibiaNepalNetherlandsNew CaledoniaNew ZealandNicaraguaNigerNigeriaNorth AmericaNorwayOECD membersOmanOther small statesPakistanPanamaPapua New GuineaParaguayPeruPhilippinesPolandPortugalPost-demographic dividendPre-demographic dividendPuerto RicoQatarRomaniaRussian FederationRwandaSaudi ArabiaSenegalSerbiaSeychellesSierra LeoneSingaporeSlovak RepublicSloveniaSmall statesSolomon IslandsSomaliaSouth AfricaSouth AsiaSouth Asia (IDA & IBRD)South SudanSpainSri LankaSt. Kitts and NevisSt. LuciaSt. Vincent and the GrenadinesSub-Saharan Africa Sub-Saharan Africa (excluding high income)Sub-Saharan Africa (IDA & IBRD countries)SudanSurinameSwazilandSwedenSwitzerlandSyrian Arab RepublicTajikistanTanzaniaThailandTimor-LesteTogoTongaTrinidad and TobagoTunisiaTurkeyTurkmenistanUgandaUkraineUnited Arab EmiratesUnited KingdomUnited StatesUpper middle incomeUruguayUzbekistanVanuatuVenezuela, RBVietnamWest Bank and GazaWorldYemen, Rep.ZambiaZimbabwe Timeline:
This timeline shows a graph from 1961 to 2016 of Thailand. No data until 1960. Number of actual observations by date: 56.
Source name:
World Development Indicators
Source organization:
World Bank national accounts data, and OECD National Accounts data files.
Categories, topics:
Economy & Growth
Last updated:
apr 23, 2017
Indicators value changes by year
Minimum:
252.198 mln
jan 1, 1961
Maximum:
69.115 bln
jan 1, 2014
At the date of observation
Value
Absolute change
Change from previous value
jan 1, 1961
252.198 mln
+252.198 mln
0.0%
jan 1, 1962
267.162 mln
+14.964 mln
5.93%
jan 1, 1963
300.766 mln
+33.604 mln
12.58%
jan 1, 1964
332.405 mln
+31.639 mln
10.52%
jan 1, 1965
359.519 mln
+27.114 mln
8.16%
jan 1, 1966
400.673 mln
+41.154 mln
11.45%
jan 1, 1967
446.538 mln
+45.865 mln
11.45%
jan 1, 1968
498.077 mln
+51.538 mln
11.54%
jan 1, 1969
612.308 mln
+114.231 mln
22.93%
jan 1, 1970
675.865 mln
+63.558 mln
10.38%
jan 1, 1971
797.019 mln
+121.154 mln
17.93%
jan 1, 1972
849.808 mln
+52.788 mln
6.62%
jan 1, 1973
892.885 mln
+43.077 mln
5.07%
jan 1, 1974
1.056 bln
+162.914 mln
18.25%
jan 1, 1975
1.28 bln
+224.441 mln
21.26%
jan 1, 1976
1.535 bln
+255.142 mln
19.93%
jan 1, 1977
1.863 bln
+327.796 mln
21.35%
jan 1, 1978
2.104 bln
+240.881 mln
12.93%
jan 1, 1979
2.684 bln
+579.986 mln
27.57%
jan 1, 1980
3.271 bln
+587.336 mln
21.88%
jan 1, 1981
3.977 bln
+705.539 mln
21.57%
jan 1, 1982
4.446 bln
+468.782 mln
11.79%
jan 1, 1983
4.79 bln
+344.147 mln
7.74%
jan 1, 1984
5.155 bln
+365.651 mln
7.63%
jan 1, 1985
5.504 bln
+348.024 mln
6.75%
jan 1, 1986
5.262 bln
-241.05 mln
-4.38%
jan 1, 1987
5.497 bln
+234.486 mln
4.46%
jan 1, 1988
5.723 bln
+226.523 mln
4.12%
jan 1, 1989
6.196 bln
+472.082 mln
8.25%
jan 1, 1990
6.879 bln
+683.199 mln
11.03%
jan 1, 1991
8.026 bln
+1.147 bln
16.68%
jan 1, 1992
9.058 bln
+1.032 bln
12.85%
jan 1, 1993
11.032 bln
+1.974 bln
21.79%
jan 1, 1994
14.18 bln
+3.148 bln
28.54%
jan 1, 1995
16.212 bln
+2.032 bln
14.33%
jan 1, 1996
19.045 bln
+2.833 bln
17.48%
jan 1, 1997
21.203 bln
+2.158 bln
11.33%
jan 1, 1998
18.148 bln
-3.056 bln
-14.41%
jan 1, 1999
14.851 bln
-3.296 bln
-18.16%
jan 1, 2000
17.188 bln
+2.337 bln
15.73%
jan 1, 2001
17.159 bln
-28.826 mln
-0.17%
jan 1, 2002
16.209 bln
-949.598 mln
-5.53%
jan 1, 2003
17.691 bln
+1.481 bln
9.14%
jan 1, 2004
19.683 bln
+1.992 bln
11.26%
jan 1, 2005
22.673 bln
+2.99 bln
15.19%
jan 1, 2006
25.849 bln
+3.176 bln
14.01%
jan 1, 2007
29.942 bln
+4.094 bln
15.84%
jan 1, 2008
36.617 bln
+6.675 bln
22.29%
jan 1, 2009
41.79 bln
+5.173 bln
14.13%
jan 1, 2010
44.965 bln
+3.174 bln
7.6%
jan 1, 2011
54.028 bln
+9.063 bln
20.16%
jan 1, 2012
59.827 bln
+5.799 bln
10.73%
jan 1, 2013
64.758 bln
+4.931 bln
8.24%
jan 1, 2014
69.115 bln
+4.358 bln
6.73%
jan 1, 2015
68.825 bln
-289.872 mln
-0.42%
jan 1, 2016
68.151 bln
-674.265 mln
-0.98%
Ranking of countries by current statistics by years


Comments: