29
/
en
AIzaSyAYiBZKx7MnpbEhh9jyipgxe19OcubqV5w
April 1, 2024
269343
Turkey
TUR
true
2
1
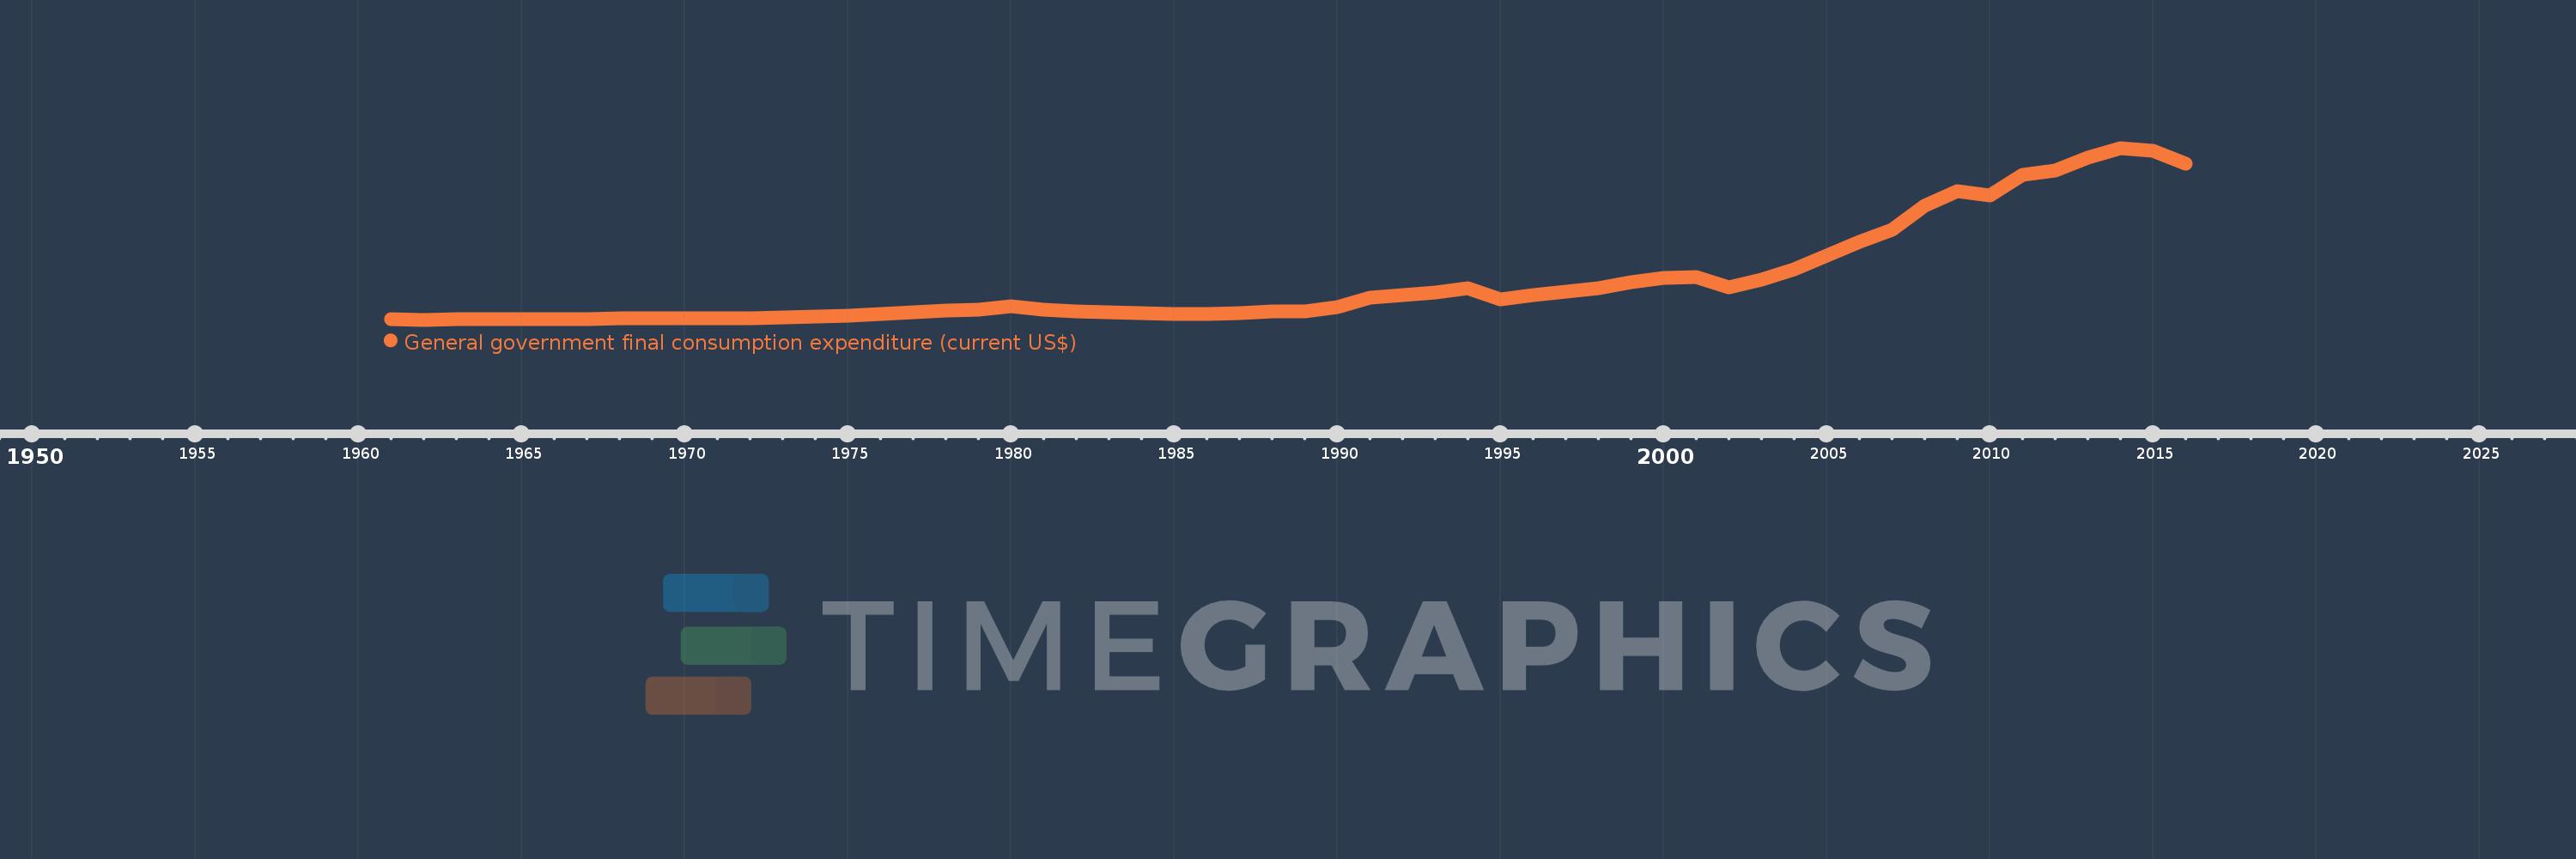
General government final consumption expenditure (current US$)
2016,2015,2014,2013,2012,2011,2010,2009,2008,2007,2006,2005,2004,2003,2002,2001,2000,1999,1998,1997,1996,1995,1994,1993,1992,1991,1990,1989,1988,1987,1986,1985,1984,1983,1982,1981,1980,1979,1978,1977,1976,1975,1974,1973,1972,1971,1970,1969,1968,1967,1966,1965,1964,1963,1962,1961
This statistics in other country:
AfghanistanAlbaniaAlgeriaAngolaAntigua and BarbudaArab WorldArgentinaArmeniaArubaAustraliaAustriaAzerbaijanBahamas, TheBahrainBangladeshBarbadosBelarusBelgiumBelizeBeninBermudaBhutanBoliviaBosnia and HerzegovinaBotswanaBrazilBrunei DarussalamBulgariaBurkina FasoBurundiCabo VerdeCambodiaCameroonCanadaCaribbean small statesCentral African RepublicCentral Europe and the BalticsChadChileChinaColombiaComorosCongo, Dem. Rep.Congo, Rep.Costa RicaCote d'IvoireCroatiaCubaCyprusCzech RepublicDenmarkDjiboutiDominicaDominican RepublicEarly-demographic dividendEast Asia & PacificEast Asia & Pacific (excluding high income)East Asia & Pacific (IDA & IBRD countries)EcuadorEgypt, Arab Rep.El SalvadorEquatorial GuineaEritreaEstoniaEthiopiaEuro areaEurope & Central AsiaEurope & Central Asia (excluding high income)Europe & Central Asia (IDA & IBRD countries)European UnionFaroe IslandsFijiFinlandFragile and conflict affected situationsFranceFrench PolynesiaGabonGambia, TheGeorgiaGermanyGhanaGreeceGrenadaGuatemalaGuineaGuinea-BissauGuyanaHaitiHeavily indebted poor countries (HIPC)High incomeHondurasHong Kong SAR, ChinaHungaryIBRD onlyIcelandIDA & IBRD totalIDA blendIDA onlyIDA totalIndiaIndonesiaIran, Islamic Rep.IraqIrelandIsraelItalyJamaicaJapanJordanKazakhstanKenyaKiribatiKorea, Rep.KosovoKuwaitKyrgyz RepublicLao PDRLate-demographic dividendLatin America & Caribbean Latin America & Caribbean (excluding high income)Latin America & the Caribbean (IDA & IBRD countries)LatviaLeast developed countries: UN classificationLebanonLesothoLiberiaLibyaLithuaniaLow & middle incomeLow incomeLower middle incomeLuxembourgMacao SAR, ChinaMacedonia, FYRMadagascarMalawiMalaysiaMaldivesMaliMaltaMauritaniaMauritiusMexicoMicronesia, Fed. Sts.Middle East & North AfricaMiddle East & North Africa (excluding high income)Middle East & North Africa (IDA & IBRD countries)Middle incomeMoldovaMongoliaMontenegroMoroccoMozambiqueNamibiaNepalNetherlandsNew CaledoniaNew ZealandNicaraguaNigerNigeriaNorth AmericaNorwayOECD membersOmanOther small statesPakistanPanamaPapua New GuineaParaguayPeruPhilippinesPolandPortugalPost-demographic dividendPre-demographic dividendPuerto RicoQatarRomaniaRussian FederationRwandaSaudi ArabiaSenegalSerbiaSeychellesSierra LeoneSingaporeSlovak RepublicSloveniaSmall statesSolomon IslandsSomaliaSouth AfricaSouth AsiaSouth Asia (IDA & IBRD)South SudanSpainSri LankaSt. Kitts and NevisSt. LuciaSt. Vincent and the GrenadinesSub-Saharan Africa Sub-Saharan Africa (excluding high income)Sub-Saharan Africa (IDA & IBRD countries)SudanSurinameSwazilandSwedenSwitzerlandSyrian Arab RepublicTajikistanTanzaniaThailandTimor-LesteTogoTongaTrinidad and TobagoTunisiaTurkeyTurkmenistanUgandaUkraineUnited Arab EmiratesUnited KingdomUnited StatesUpper middle incomeUruguayUzbekistanVanuatuVenezuela, RBVietnamWest Bank and GazaWorldYemen, Rep.ZambiaZimbabwe Timeline:
This timeline shows a graph from 1961 to 2016 of Turkey. No data until 1960. Number of actual observations by date: 56.
Source name:
World Development Indicators
Source organization:
World Bank national accounts data, and OECD National Accounts data files.
Categories, topics:
Economy & Growth
Last updated:
apr 23, 2017
Indicators value changes by year
Minimum:
744.444 mln
jan 1, 1962
Maximum:
124.274 bln
jan 1, 2014
At the date of observation
Value
Absolute change
Change from previous value
jan 1, 1961
1.171 bln
+1.171 bln
0.0%
jan 1, 1962
744.444 mln
-426.949 mln
-36.45%
jan 1, 1963
877.778 mln
+133.333 mln
17.91%
jan 1, 1964
977.778 mln
+100.0 mln
11.39%
jan 1, 1965
1.1 bln
+122.222 mln
12.5%
jan 1, 1966
1.233 bln
+133.333 mln
12.12%
jan 1, 1967
1.4 bln
+166.667 mln
13.51%
jan 1, 1968
1.589 bln
+188.889 mln
13.49%
jan 1, 1969
1.744 bln
+155.556 mln
9.79%
jan 1, 1970
1.911 bln
+166.667 mln
9.55%
jan 1, 1971
1.809 bln
-102.415 mln
-5.36%
jan 1, 1972
1.864 bln
+54.95 mln
3.04%
jan 1, 1973
2.198 bln
+334.234 mln
17.93%
jan 1, 1974
2.89 bln
+692.58 mln
31.51%
jan 1, 1975
3.748 bln
+857.656 mln
29.67%
jan 1, 1976
4.916 bln
+1.168 bln
31.17%
jan 1, 1977
5.856 bln
+939.387 mln
19.11%
jan 1, 1978
7.177 bln
+1.321 bln
22.57%
jan 1, 1979
7.899 bln
+721.875 mln
10.06%
jan 1, 1980
10.503 bln
+2.604 bln
32.97%
jan 1, 1981
7.947 bln
-2.556 bln
-24.33%
jan 1, 1982
6.991 bln
-956.63 mln
-12.04%
jan 1, 1983
6.418 bln
-572.498 mln
-8.19%
jan 1, 1984
5.79 bln
-627.753 mln
-9.78%
jan 1, 1985
5.001 bln
-789.916 mln
-13.64%
jan 1, 1986
5.053 bln
+52.493 mln
1.05%
jan 1, 1987
5.746 bln
+693.207 mln
13.72%
jan 1, 1988
6.819 bln
+1.073 bln
18.68%
jan 1, 1989
6.916 bln
+96.883 mln
1.42%
jan 1, 1990
10.011 bln
+3.094 bln
44.74%
jan 1, 1991
16.516 bln
+6.505 bln
64.98%
jan 1, 1992
18.632 bln
+2.117 bln
12.82%
jan 1, 1993
20.481 bln
+1.849 bln
9.92%
jan 1, 1994
23.231 bln
+2.75 bln
13.43%
jan 1, 1995
15.235 bln
-7.996 bln
-34.42%
jan 1, 1996
18.28 bln
+3.045 bln
19.99%
jan 1, 1997
20.998 bln
+2.718 bln
14.87%
jan 1, 1998
23.273 bln
+2.274 bln
10.83%
jan 1, 1999
27.609 bln
+4.337 bln
18.63%
jan 1, 2000
30.542 bln
+2.933 bln
10.62%
jan 1, 2001
31.259 bln
+716.731 mln
2.35%
jan 1, 2002
24.297 bln
-6.961 bln
-22.27%
jan 1, 2003
29.601 bln
+5.304 bln
21.83%
jan 1, 2004
36.967 bln
+7.365 bln
24.88%
jan 1, 2005
46.862 bln
+9.895 bln
26.77%
jan 1, 2006
56.936 bln
+10.073 bln
21.5%
jan 1, 2007
65.471 bln
+8.535 bln
14.99%
jan 1, 2008
82.749 bln
+17.278 bln
26.39%
jan 1, 2009
93.491 bln
+10.743 bln
12.98%
jan 1, 2010
90.344 bln
-3.148 bln
-3.37%
jan 1, 2011
104.81 bln
+14.466 bln
16.01%
jan 1, 2012
107.888 bln
+3.078 bln
2.94%
jan 1, 2013
117.099 bln
+9.211 bln
8.54%
jan 1, 2014
124.274 bln
+7.175 bln
6.13%
jan 1, 2015
122.527 bln
-1.747 bln
-1.41%
jan 1, 2016
112.693 bln
-9.834 bln
-8.03%
Ranking of countries by current statistics by years


Comments: