29
/
en
AIzaSyAYiBZKx7MnpbEhh9jyipgxe19OcubqV5w
April 1, 2024
209330
New Zealand
NZL
true
2
1
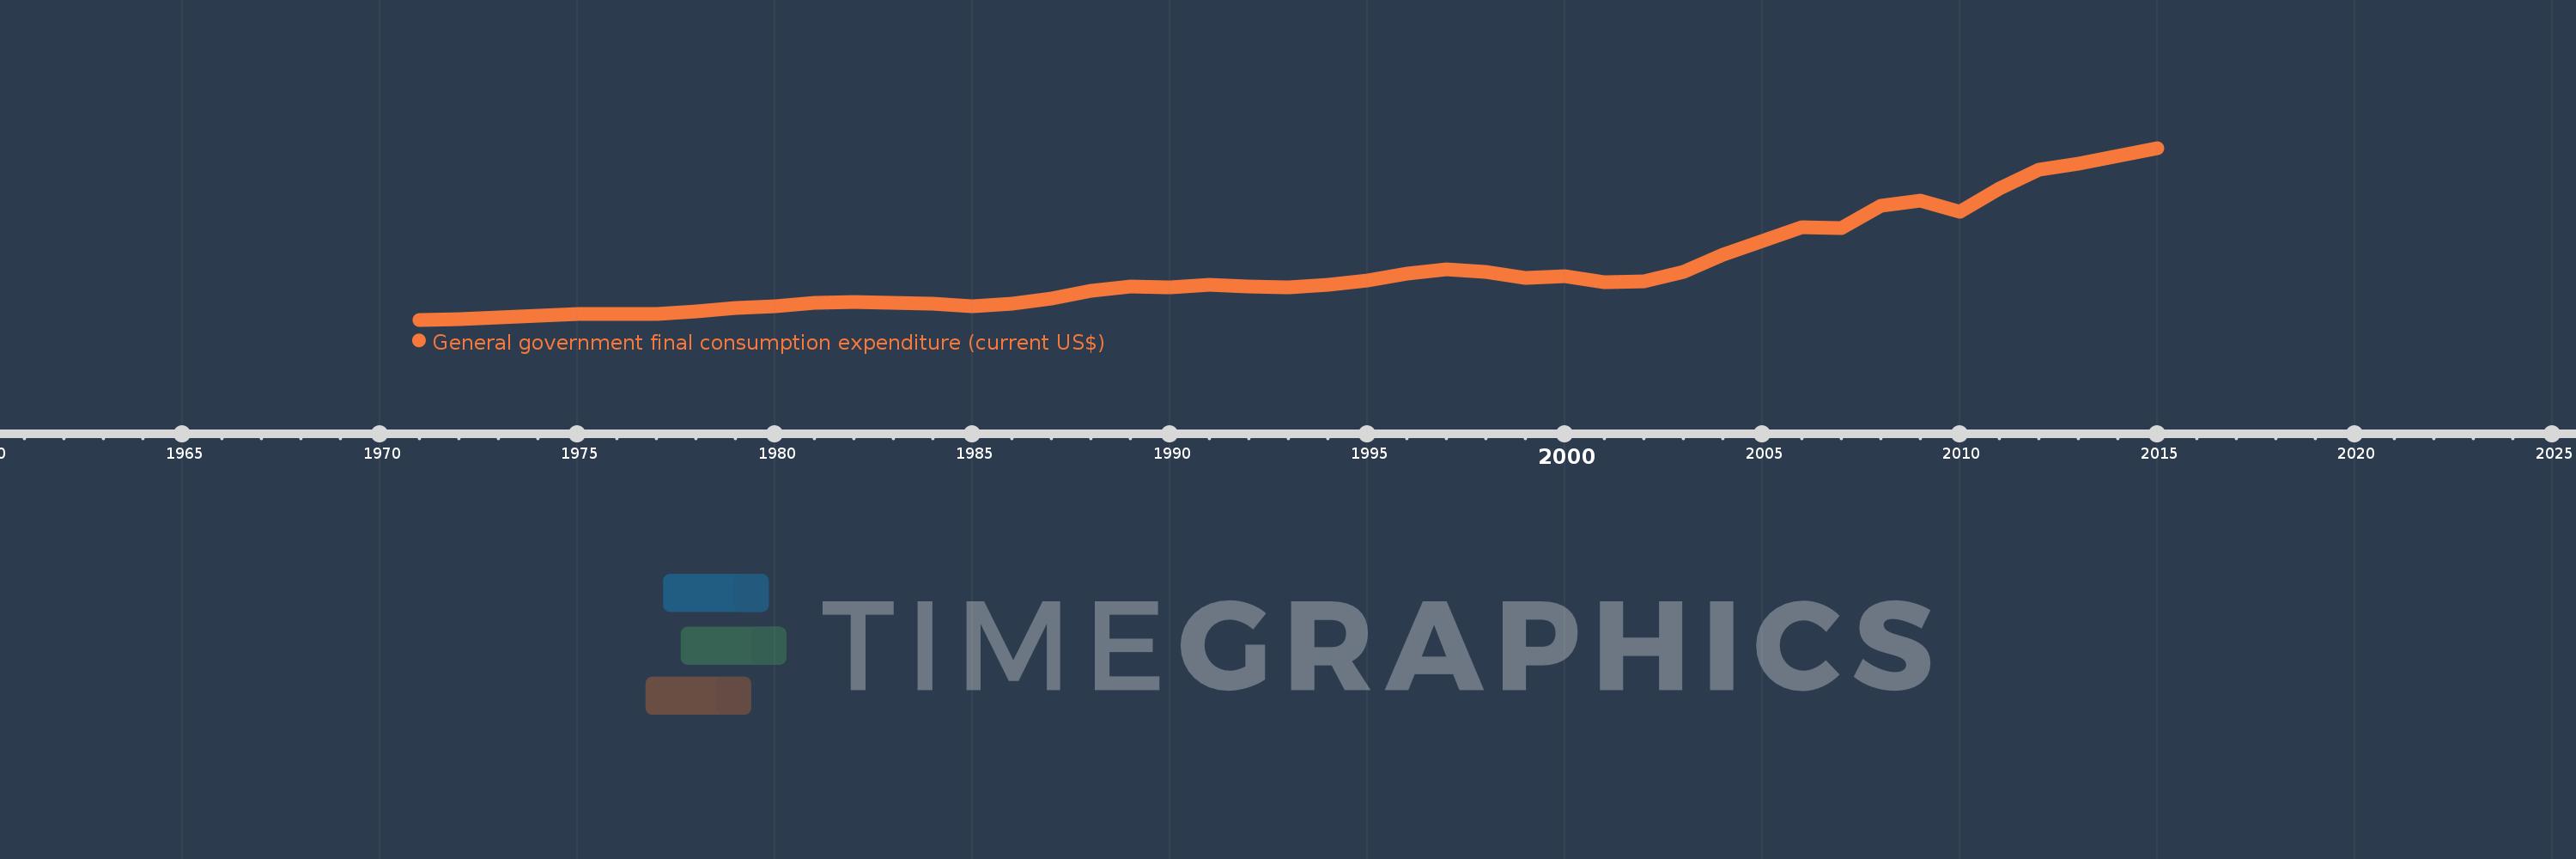
General government final consumption expenditure (current US$)
2015,2014,2013,2012,2011,2010,2009,2008,2007,2006,2005,2004,2003,2002,2001,2000,1999,1998,1997,1996,1995,1994,1993,1992,1991,1990,1989,1988,1987,1986,1985,1984,1983,1982,1981,1980,1979,1978,1977,1976,1975,1974,1973,1972,1971
This statistics in other country:
AfghanistanAlbaniaAlgeriaAngolaAntigua and BarbudaArab WorldArgentinaArmeniaArubaAustraliaAustriaAzerbaijanBahamas, TheBahrainBangladeshBarbadosBelarusBelgiumBelizeBeninBermudaBhutanBoliviaBosnia and HerzegovinaBotswanaBrazilBrunei DarussalamBulgariaBurkina FasoBurundiCabo VerdeCambodiaCameroonCanadaCaribbean small statesCentral African RepublicCentral Europe and the BalticsChadChileChinaColombiaComorosCongo, Dem. Rep.Congo, Rep.Costa RicaCote d'IvoireCroatiaCubaCyprusCzech RepublicDenmarkDjiboutiDominicaDominican RepublicEarly-demographic dividendEast Asia & PacificEast Asia & Pacific (excluding high income)East Asia & Pacific (IDA & IBRD countries)EcuadorEgypt, Arab Rep.El SalvadorEquatorial GuineaEritreaEstoniaEthiopiaEuro areaEurope & Central AsiaEurope & Central Asia (excluding high income)Europe & Central Asia (IDA & IBRD countries)European UnionFaroe IslandsFijiFinlandFragile and conflict affected situationsFranceFrench PolynesiaGabonGambia, TheGeorgiaGermanyGhanaGreeceGrenadaGuatemalaGuineaGuinea-BissauGuyanaHaitiHeavily indebted poor countries (HIPC)High incomeHondurasHong Kong SAR, ChinaHungaryIBRD onlyIcelandIDA & IBRD totalIDA blendIDA onlyIDA totalIndiaIndonesiaIran, Islamic Rep.IraqIrelandIsraelItalyJamaicaJapanJordanKazakhstanKenyaKiribatiKorea, Rep.KosovoKuwaitKyrgyz RepublicLao PDRLate-demographic dividendLatin America & Caribbean Latin America & Caribbean (excluding high income)Latin America & the Caribbean (IDA & IBRD countries)LatviaLeast developed countries: UN classificationLebanonLesothoLiberiaLibyaLithuaniaLow & middle incomeLow incomeLower middle incomeLuxembourgMacao SAR, ChinaMacedonia, FYRMadagascarMalawiMalaysiaMaldivesMaliMaltaMauritaniaMauritiusMexicoMicronesia, Fed. Sts.Middle East & North AfricaMiddle East & North Africa (excluding high income)Middle East & North Africa (IDA & IBRD countries)Middle incomeMoldovaMongoliaMontenegroMoroccoMozambiqueNamibiaNepalNetherlandsNew CaledoniaNew ZealandNicaraguaNigerNigeriaNorth AmericaNorwayOECD membersOmanOther small statesPakistanPanamaPapua New GuineaParaguayPeruPhilippinesPolandPortugalPost-demographic dividendPre-demographic dividendPuerto RicoQatarRomaniaRussian FederationRwandaSaudi ArabiaSenegalSerbiaSeychellesSierra LeoneSingaporeSlovak RepublicSloveniaSmall statesSolomon IslandsSomaliaSouth AfricaSouth AsiaSouth Asia (IDA & IBRD)South SudanSpainSri LankaSt. Kitts and NevisSt. LuciaSt. Vincent and the GrenadinesSub-Saharan Africa Sub-Saharan Africa (excluding high income)Sub-Saharan Africa (IDA & IBRD countries)SudanSurinameSwazilandSwedenSwitzerlandSyrian Arab RepublicTajikistanTanzaniaThailandTimor-LesteTogoTongaTrinidad and TobagoTunisiaTurkeyTurkmenistanUgandaUkraineUnited Arab EmiratesUnited KingdomUnited StatesUpper middle incomeUruguayUzbekistanVanuatuVenezuela, RBVietnamWest Bank and GazaWorldYemen, Rep.ZambiaZimbabwe Timeline:
This timeline shows a graph from 1971 to 2015 of New Zealand. No data until 1970. Number of actual observations by date: 45.
Source name:
World Development Indicators
Source organization:
World Bank national accounts data, and OECD National Accounts data files.
Categories, topics:
Economy & Growth
Last updated:
apr 23, 2017
Indicators value changes by year
Minimum:
986.397 mln
jan 1, 1971
Maximum:
37.312 bln
jan 1, 2015
At the date of observation
Value
Absolute change
Change from previous value
jan 1, 1971
986.397 mln
+986.397 mln
0.0%
jan 1, 1972
1.169 bln
+182.674 mln
18.52%
jan 1, 1973
1.411 bln
+241.965 mln
20.7%
jan 1, 1974
1.856 bln
+445.094 mln
31.54%
jan 1, 1975
2.275 bln
+419.105 mln
22.58%
jan 1, 1976
2.242 bln
-33.31 mln
-1.46%
jan 1, 1977
2.216 bln
-26.414 mln
-1.18%
jan 1, 1978
2.698 bln
+482.228 mln
21.77%
jan 1, 1979
3.472 bln
+774.251 mln
28.7%
jan 1, 1980
3.827 bln
+354.515 mln
10.21%
jan 1, 1981
4.544 bln
+717.984 mln
18.76%
jan 1, 1982
4.686 bln
+141.215 mln
3.11%
jan 1, 1983
4.623 bln
-62.252 mln
-1.33%
jan 1, 1984
4.443 bln
-180.103 mln
-3.9%
jan 1, 1985
3.828 bln
-615.184 mln
-13.85%
jan 1, 1986
4.409 bln
+580.53 mln
15.16%
jan 1, 1987
5.425 bln
+1.016 bln
23.04%
jan 1, 1988
7.084 bln
+1.659 bln
30.59%
jan 1, 1989
7.948 bln
+863.951 mln
12.2%
jan 1, 1990
7.819 bln
-129.278 mln
-1.63%
jan 1, 1991
8.392 bln
+573.851 mln
7.34%
jan 1, 1992
7.991 bln
-401.176 mln
-4.78%
jan 1, 1993
7.853 bln
-138.181 mln
-1.73%
jan 1, 1994
8.294 bln
+440.748 mln
5.61%
jan 1, 1995
9.289 bln
+995.545 mln
12.0%
jan 1, 1996
10.739 bln
+1.45 bln
15.61%
jan 1, 1997
11.666 bln
+927.195 mln
8.63%
jan 1, 1998
11.123 bln
-543.067 mln
-4.65%
jan 1, 1999
9.823 bln
-1.3 bln
-11.69%
jan 1, 2000
10.113 bln
+289.987 mln
2.95%
jan 1, 2001
8.952 bln
-1.161 bln
-11.48%
jan 1, 2002
9.058 bln
+106.433 mln
1.19%
jan 1, 2003
11.109 bln
+2.051 bln
22.64%
jan 1, 2004
14.759 bln
+3.65 bln
32.85%
jan 1, 2005
17.644 bln
+2.885 bln
19.55%
jan 1, 2006
20.478 bln
+2.834 bln
16.06%
jan 1, 2007
20.362 bln
-115.575 mln
-0.56%
jan 1, 2008
25.131 bln
+4.769 bln
23.42%
jan 1, 2009
26.169 bln
+1.038 bln
4.13%
jan 1, 2010
23.839 bln
-2.33 bln
-8.9%
jan 1, 2011
28.655 bln
+4.816 bln
20.2%
jan 1, 2012
32.711 bln
+4.056 bln
14.15%
jan 1, 2013
33.928 bln
+1.217 bln
3.72%
jan 1, 2014
35.7 bln
+1.772 bln
5.22%
jan 1, 2015
37.312 bln
+1.612 bln
4.52%
Ranking of countries by current statistics by years


Comments: