29
/
en
AIzaSyAYiBZKx7MnpbEhh9jyipgxe19OcubqV5w
April 1, 2024
280988
Venezuela, RB
VEN
true
2
1
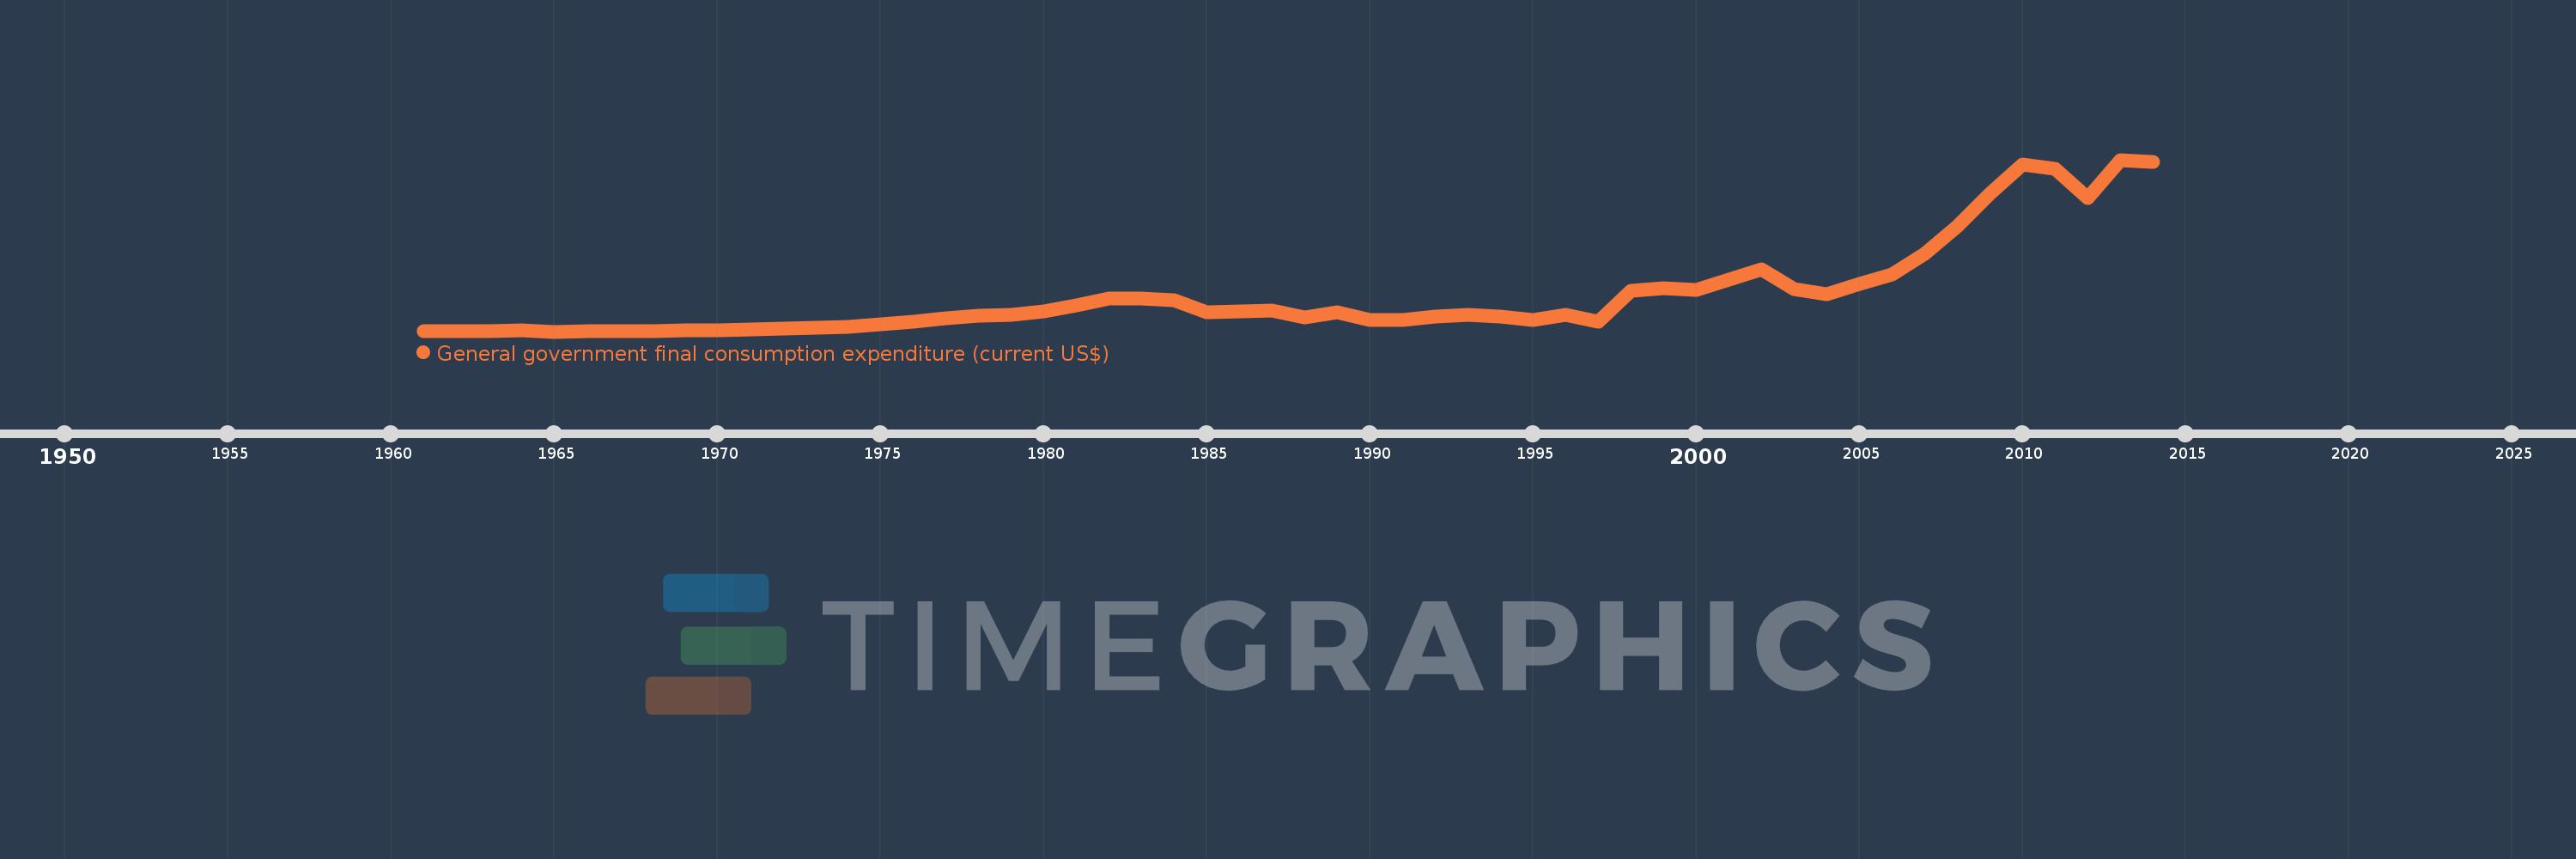
General government final consumption expenditure (current US$)
2014,2013,2012,2011,2010,2009,2008,2007,2006,2005,2004,2003,2002,2001,2000,1999,1998,1997,1996,1995,1994,1993,1992,1991,1990,1989,1988,1987,1986,1985,1984,1983,1982,1981,1980,1979,1978,1977,1976,1975,1974,1973,1972,1971,1970,1969,1968,1967,1966,1965,1964,1963,1962,1961
This statistics in other country:
AfghanistanAlbaniaAlgeriaAngolaAntigua and BarbudaArab WorldArgentinaArmeniaArubaAustraliaAustriaAzerbaijanBahamas, TheBahrainBangladeshBarbadosBelarusBelgiumBelizeBeninBermudaBhutanBoliviaBosnia and HerzegovinaBotswanaBrazilBrunei DarussalamBulgariaBurkina FasoBurundiCabo VerdeCambodiaCameroonCanadaCaribbean small statesCentral African RepublicCentral Europe and the BalticsChadChileChinaColombiaComorosCongo, Dem. Rep.Congo, Rep.Costa RicaCote d'IvoireCroatiaCubaCyprusCzech RepublicDenmarkDjiboutiDominicaDominican RepublicEarly-demographic dividendEast Asia & PacificEast Asia & Pacific (excluding high income)East Asia & Pacific (IDA & IBRD countries)EcuadorEgypt, Arab Rep.El SalvadorEquatorial GuineaEritreaEstoniaEthiopiaEuro areaEurope & Central AsiaEurope & Central Asia (excluding high income)Europe & Central Asia (IDA & IBRD countries)European UnionFaroe IslandsFijiFinlandFragile and conflict affected situationsFranceFrench PolynesiaGabonGambia, TheGeorgiaGermanyGhanaGreeceGrenadaGuatemalaGuineaGuinea-BissauGuyanaHaitiHeavily indebted poor countries (HIPC)High incomeHondurasHong Kong SAR, ChinaHungaryIBRD onlyIcelandIDA & IBRD totalIDA blendIDA onlyIDA totalIndiaIndonesiaIran, Islamic Rep.IraqIrelandIsraelItalyJamaicaJapanJordanKazakhstanKenyaKiribatiKorea, Rep.KosovoKuwaitKyrgyz RepublicLao PDRLate-demographic dividendLatin America & Caribbean Latin America & Caribbean (excluding high income)Latin America & the Caribbean (IDA & IBRD countries)LatviaLeast developed countries: UN classificationLebanonLesothoLiberiaLibyaLithuaniaLow & middle incomeLow incomeLower middle incomeLuxembourgMacao SAR, ChinaMacedonia, FYRMadagascarMalawiMalaysiaMaldivesMaliMaltaMauritaniaMauritiusMexicoMicronesia, Fed. Sts.Middle East & North AfricaMiddle East & North Africa (excluding high income)Middle East & North Africa (IDA & IBRD countries)Middle incomeMoldovaMongoliaMontenegroMoroccoMozambiqueNamibiaNepalNetherlandsNew CaledoniaNew ZealandNicaraguaNigerNigeriaNorth AmericaNorwayOECD membersOmanOther small statesPakistanPanamaPapua New GuineaParaguayPeruPhilippinesPolandPortugalPost-demographic dividendPre-demographic dividendPuerto RicoQatarRomaniaRussian FederationRwandaSaudi ArabiaSenegalSerbiaSeychellesSierra LeoneSingaporeSlovak RepublicSloveniaSmall statesSolomon IslandsSomaliaSouth AfricaSouth AsiaSouth Asia (IDA & IBRD)South SudanSpainSri LankaSt. Kitts and NevisSt. LuciaSt. Vincent and the GrenadinesSub-Saharan Africa Sub-Saharan Africa (excluding high income)Sub-Saharan Africa (IDA & IBRD countries)SudanSurinameSwazilandSwedenSwitzerlandSyrian Arab RepublicTajikistanTanzaniaThailandTimor-LesteTogoTongaTrinidad and TobagoTunisiaTurkeyTurkmenistanUgandaUkraineUnited Arab EmiratesUnited KingdomUnited StatesUpper middle incomeUruguayUzbekistanVanuatuVenezuela, RBVietnamWest Bank and GazaWorldYemen, Rep.ZambiaZimbabwe Timeline:
This timeline shows a graph from 1961 to 2014 of Venezuela, RB. No data until 1960. Number of actual observations by date: 54.
Source name:
World Development Indicators
Source organization:
World Bank national accounts data, and OECD National Accounts data files.
Categories, topics:
Economy & Growth
Last updated:
apr 23, 2017
Indicators value changes by year
Minimum:
901.591 mln
jan 1, 1965
Maximum:
46.486 bln
jan 1, 2013
At the date of observation
Value
Absolute change
Change from previous value
jan 1, 1961
1.048 bln
+1.048 bln
0.0%
jan 1, 1962
929.576 mln
-118.0 mln
-11.26%
jan 1, 1963
1.009 bln
+79.667 mln
8.57%
jan 1, 1964
1.176 bln
+166.424 mln
16.49%
jan 1, 1965
901.591 mln
-274.076 mln
-23.31%
jan 1, 1966
967.689 mln
+66.098 mln
7.33%
jan 1, 1967
1.054 bln
+86.022 mln
8.89%
jan 1, 1968
1.118 bln
+64.511 mln
6.12%
jan 1, 1969
1.226 bln
+107.511 mln
9.61%
jan 1, 1970
1.312 bln
+86.022 mln
7.02%
jan 1, 1971
1.419 bln
+107.511 mln
8.2%
jan 1, 1972
1.715 bln
+296.188 mln
20.87%
jan 1, 1973
1.869 bln
+153.932 mln
8.97%
jan 1, 1974
2.16 bln
+291.032 mln
15.57%
jan 1, 1975
2.881 bln
+720.14 mln
33.33%
jan 1, 1976
3.578 bln
+697.628 mln
24.22%
jan 1, 1977
4.456 bln
+877.674 mln
24.53%
jan 1, 1978
5.176 bln
+720.14 mln
16.16%
jan 1, 1979
5.424 bln
+247.558 mln
4.78%
jan 1, 1980
6.256 bln
+832.651 mln
15.35%
jan 1, 1981
7.899 bln
+1.643 bln
26.26%
jan 1, 1982
9.587 bln
+1.688 bln
21.37%
jan 1, 1983
9.587 bln
0.0
0.0%
jan 1, 1984
9.294 bln
-292.558 mln
-3.05%
jan 1, 1985
5.987 bln
-3.307 bln
-35.58%
jan 1, 1986
6.264 bln
+276.43 mln
4.62%
jan 1, 1987
6.536 bln
+272.522 mln
4.35%
jan 1, 1988
4.746 bln
-1.79 bln
-27.39%
jan 1, 1989
6.136 bln
+1.39 bln
29.29%
jan 1, 1990
4.026 bln
-2.11 bln
-34.39%
jan 1, 1991
3.958 bln
-68.37 mln
-1.7%
jan 1, 1992
4.995 bln
+1.038 bln
26.22%
jan 1, 1993
5.368 bln
+372.507 mln
7.46%
jan 1, 1994
4.967 bln
-401.371 mln
-7.48%
jan 1, 1995
4.086 bln
-880.759 mln
-17.73%
jan 1, 1996
5.336 bln
+1.25 bln
30.59%
jan 1, 1997
3.422 bln
-1.914 bln
-35.87%
jan 1, 1998
11.617 bln
+8.195 bln
239.47%
jan 1, 1999
12.3 bln
+683.714 mln
5.89%
jan 1, 2000
12.068 bln
-232.44 mln
-1.89%
jan 1, 2001
14.584 bln
+2.516 bln
20.85%
jan 1, 2002
17.498 bln
+2.914 bln
19.98%
jan 1, 2003
12.083 bln
-5.415 bln
-30.95%
jan 1, 2004
10.763 bln
-1.32 bln
-10.93%
jan 1, 2005
13.445 bln
+2.682 bln
24.92%
jan 1, 2006
16.087 bln
+2.643 bln
19.66%
jan 1, 2007
21.486 bln
+5.399 bln
33.56%
jan 1, 2008
28.729 bln
+7.242 bln
33.71%
jan 1, 2009
37.424 bln
+8.695 bln
30.27%
jan 1, 2010
45.131 bln
+7.708 bln
20.6%
jan 1, 2011
44.143 bln
-988.059 mln
-2.19%
jan 1, 2012
36.452 bln
-7.692 bln
-17.42%
jan 1, 2013
46.486 bln
+10.034 bln
27.53%
jan 1, 2014
46.004 bln
-482.028 mln
-1.04%
Ranking of countries by current statistics by years


Comments: