29
/
en
AIzaSyAYiBZKx7MnpbEhh9jyipgxe19OcubqV5w
April 1, 2024
94878
Burkina Faso
BFA
true
2
1
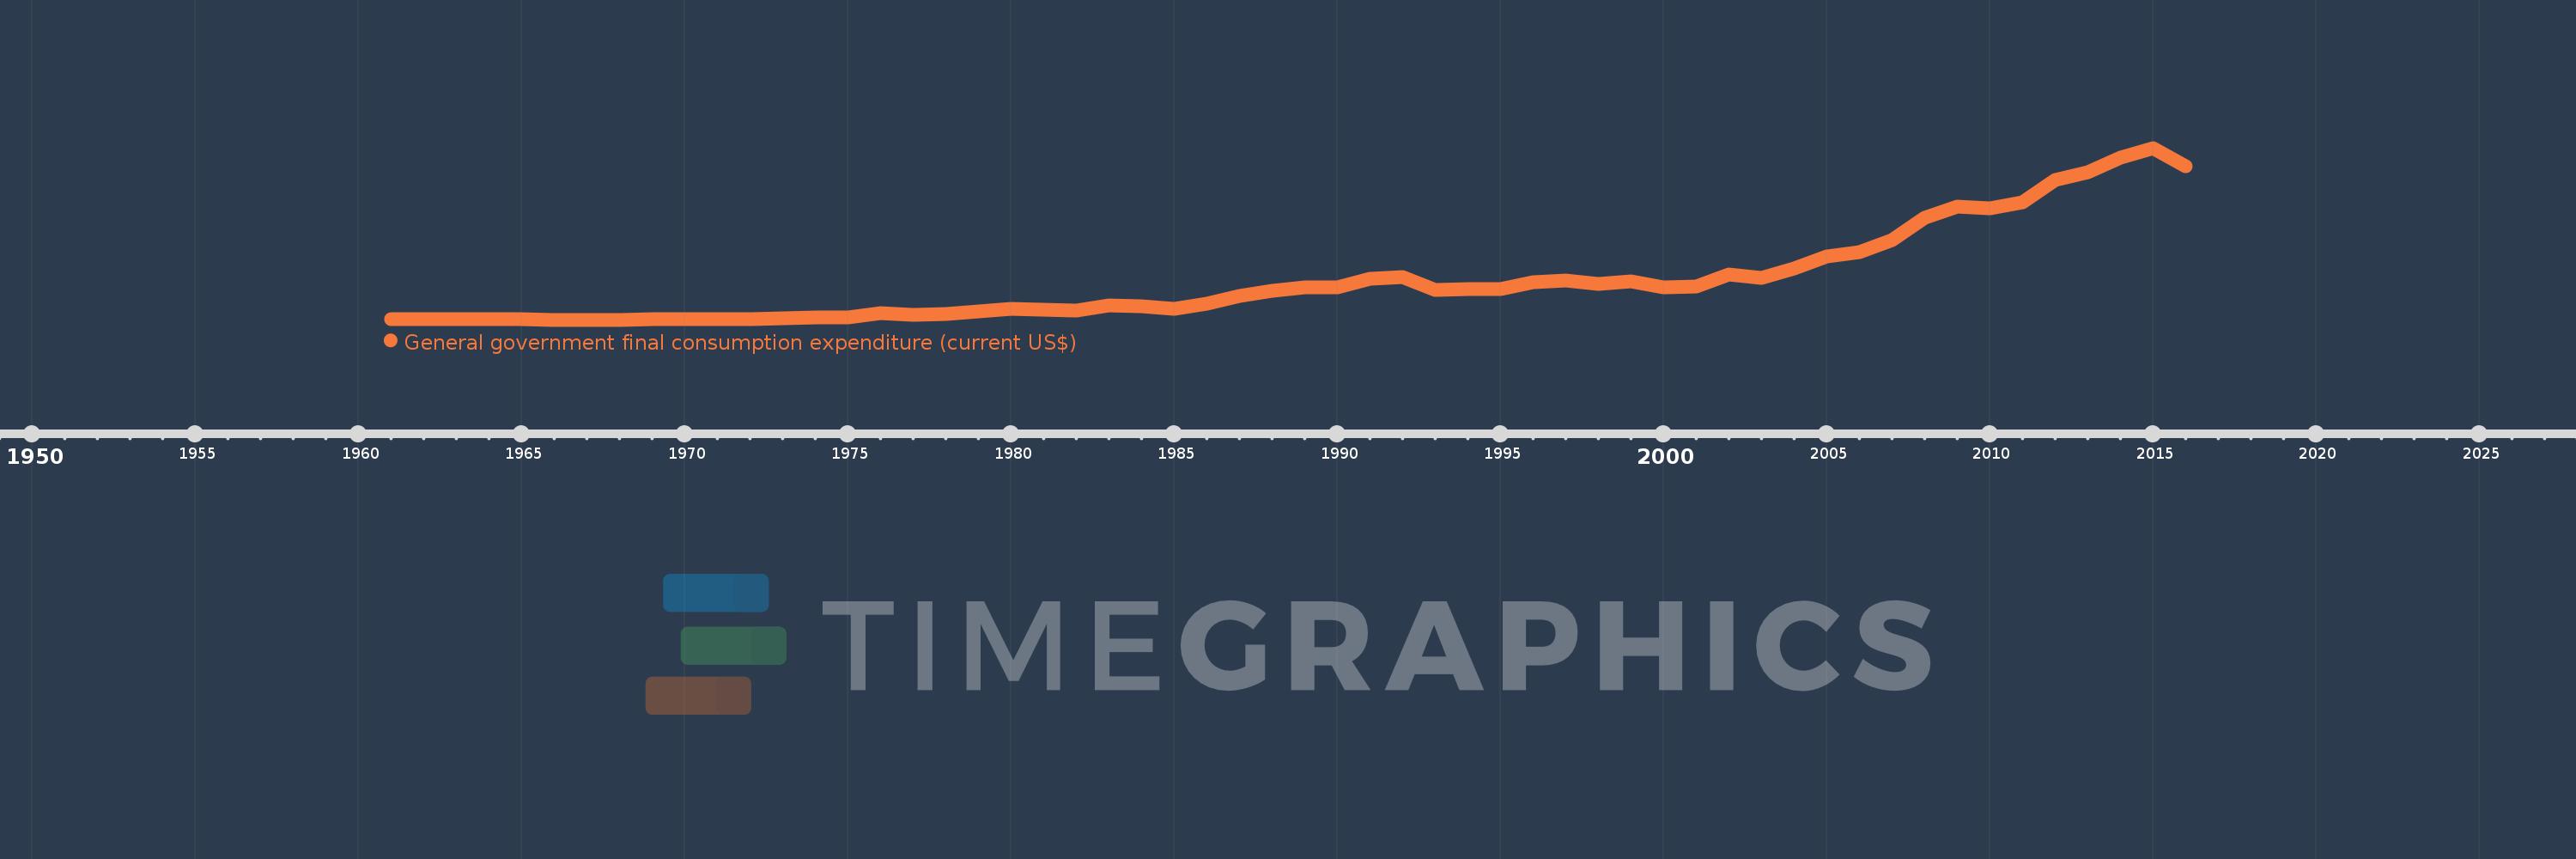
General government final consumption expenditure (current US$)
2016,2015,2014,2013,2012,2011,2010,2009,2008,2007,2006,2005,2004,2003,2002,2001,2000,1999,1998,1997,1996,1995,1994,1993,1992,1991,1990,1989,1988,1987,1986,1985,1984,1983,1982,1981,1980,1979,1978,1977,1976,1975,1974,1973,1972,1971,1970,1969,1968,1967,1966,1965,1964,1963,1962,1961
This statistics in other country:
AfghanistanAlbaniaAlgeriaAngolaAntigua and BarbudaArab WorldArgentinaArmeniaArubaAustraliaAustriaAzerbaijanBahamas, TheBahrainBangladeshBarbadosBelarusBelgiumBelizeBeninBermudaBhutanBoliviaBosnia and HerzegovinaBotswanaBrazilBrunei DarussalamBulgariaBurkina FasoBurundiCabo VerdeCambodiaCameroonCanadaCaribbean small statesCentral African RepublicCentral Europe and the BalticsChadChileChinaColombiaComorosCongo, Dem. Rep.Congo, Rep.Costa RicaCote d'IvoireCroatiaCubaCyprusCzech RepublicDenmarkDjiboutiDominicaDominican RepublicEarly-demographic dividendEast Asia & PacificEast Asia & Pacific (excluding high income)East Asia & Pacific (IDA & IBRD countries)EcuadorEgypt, Arab Rep.El SalvadorEquatorial GuineaEritreaEstoniaEthiopiaEuro areaEurope & Central AsiaEurope & Central Asia (excluding high income)Europe & Central Asia (IDA & IBRD countries)European UnionFaroe IslandsFijiFinlandFragile and conflict affected situationsFranceFrench PolynesiaGabonGambia, TheGeorgiaGermanyGhanaGreeceGrenadaGuatemalaGuineaGuinea-BissauGuyanaHaitiHeavily indebted poor countries (HIPC)High incomeHondurasHong Kong SAR, ChinaHungaryIBRD onlyIcelandIDA & IBRD totalIDA blendIDA onlyIDA totalIndiaIndonesiaIran, Islamic Rep.IraqIrelandIsraelItalyJamaicaJapanJordanKazakhstanKenyaKiribatiKorea, Rep.KosovoKuwaitKyrgyz RepublicLao PDRLate-demographic dividendLatin America & Caribbean Latin America & Caribbean (excluding high income)Latin America & the Caribbean (IDA & IBRD countries)LatviaLeast developed countries: UN classificationLebanonLesothoLiberiaLibyaLithuaniaLow & middle incomeLow incomeLower middle incomeLuxembourgMacao SAR, ChinaMacedonia, FYRMadagascarMalawiMalaysiaMaldivesMaliMaltaMauritaniaMauritiusMexicoMicronesia, Fed. Sts.Middle East & North AfricaMiddle East & North Africa (excluding high income)Middle East & North Africa (IDA & IBRD countries)Middle incomeMoldovaMongoliaMontenegroMoroccoMozambiqueNamibiaNepalNetherlandsNew CaledoniaNew ZealandNicaraguaNigerNigeriaNorth AmericaNorwayOECD membersOmanOther small statesPakistanPanamaPapua New GuineaParaguayPeruPhilippinesPolandPortugalPost-demographic dividendPre-demographic dividendPuerto RicoQatarRomaniaRussian FederationRwandaSaudi ArabiaSenegalSerbiaSeychellesSierra LeoneSingaporeSlovak RepublicSloveniaSmall statesSolomon IslandsSomaliaSouth AfricaSouth AsiaSouth Asia (IDA & IBRD)South SudanSpainSri LankaSt. Kitts and NevisSt. LuciaSt. Vincent and the GrenadinesSub-Saharan Africa Sub-Saharan Africa (excluding high income)Sub-Saharan Africa (IDA & IBRD countries)SudanSurinameSwazilandSwedenSwitzerlandSyrian Arab RepublicTajikistanTanzaniaThailandTimor-LesteTogoTongaTrinidad and TobagoTunisiaTurkeyTurkmenistanUgandaUkraineUnited Arab EmiratesUnited KingdomUnited StatesUpper middle incomeUruguayUzbekistanVanuatuVenezuela, RBVietnamWest Bank and GazaWorldYemen, Rep.ZambiaZimbabwe Timeline:
This timeline shows a graph from 1961 to 2016 of Burkina Faso. No data until 1960. Number of actual observations by date: 56.
Source name:
World Development Indicators
Source organization:
World Bank national accounts data, and OECD National Accounts data files.
Categories, topics:
Economy & Growth
Last updated:
apr 23, 2017
Indicators value changes by year
Minimum:
19.471 mln
jan 1, 1968
Maximum:
2.704 bln
jan 1, 2015
At the date of observation
Value
Absolute change
Change from previous value
jan 1, 1961
24.54 mln
+24.54 mln
0.0%
jan 1, 1962
26.807 mln
+2.266 mln
9.24%
jan 1, 1963
28.651 mln
+1.844 mln
6.88%
jan 1, 1964
29.105 mln
+454.175K
1.59%
jan 1, 1965
28.65 mln
-455.73K
-1.57%
jan 1, 1966
21.362 mln
-7.288 mln
-25.44%
jan 1, 1967
19.946 mln
-1.415 mln
-6.63%
jan 1, 1968
19.471 mln
-475.775K
-2.39%
jan 1, 1969
27.896 mln
+8.425 mln
43.27%
jan 1, 1970
28.278 mln
+381.75K
1.37%
jan 1, 1971
31.836 mln
+3.558 mln
12.58%
jan 1, 1972
34.425 mln
+2.589 mln
8.13%
jan 1, 1973
42.038 mln
+7.613 mln
22.12%
jan 1, 1974
54.536 mln
+12.498 mln
29.73%
jan 1, 1975
62.086 mln
+7.55 mln
13.84%
jan 1, 1976
121.185 mln
+59.099 mln
95.19%
jan 1, 1977
98.947 mln
-22.238 mln
-18.35%
jan 1, 1978
113.489 mln
+14.541 mln
14.7%
jan 1, 1979
148.267 mln
+34.779 mln
30.65%
jan 1, 1980
188.743 mln
+40.476 mln
27.3%
jan 1, 1981
178.005 mln
-10.738 mln
-5.69%
jan 1, 1982
164.34 mln
-13.665 mln
-7.68%
jan 1, 1983
241.869 mln
+77.528 mln
47.18%
jan 1, 1984
230.073 mln
-11.796 mln
-4.88%
jan 1, 1985
190.42 mln
-39.653 mln
-17.23%
jan 1, 1986
268.619 mln
+78.199 mln
41.07%
jan 1, 1987
386.742 mln
+118.122 mln
43.97%
jan 1, 1988
472.535 mln
+85.794 mln
22.18%
jan 1, 1989
523.73 mln
+51.195 mln
10.83%
jan 1, 1990
526.733 mln
+3.003 mln
0.57%
jan 1, 1991
653.041 mln
+126.308 mln
23.98%
jan 1, 1992
680.026 mln
+26.985 mln
4.13%
jan 1, 1993
486.889 mln
-193.137 mln
-28.4%
jan 1, 1994
497.658 mln
+10.769 mln
2.21%
jan 1, 1995
494.006 mln
-3.652 mln
-0.73%
jan 1, 1996
599.607 mln
+105.601 mln
21.38%
jan 1, 1997
630.849 mln
+31.242 mln
5.21%
jan 1, 1998
580.912 mln
-49.937 mln
-7.92%
jan 1, 1999
625.419 mln
+44.507 mln
7.66%
jan 1, 2000
527.726 mln
-97.693 mln
-15.62%
jan 1, 2001
543.07 mln
+15.344 mln
2.91%
jan 1, 2002
725.464 mln
+182.394 mln
33.59%
jan 1, 2003
679.541 mln
-45.923 mln
-6.33%
jan 1, 2004
814.494 mln
+134.953 mln
19.86%
jan 1, 2005
1.005 bln
+190.97 mln
23.45%
jan 1, 2006
1.079 bln
+73.618 mln
7.32%
jan 1, 2007
1.261 bln
+181.565 mln
16.83%
jan 1, 2008
1.617 bln
+356.035 mln
28.24%
jan 1, 2009
1.788 bln
+171.461 mln
10.61%
jan 1, 2010
1.763 bln
-25.474 mln
-1.42%
jan 1, 2011
1.855 bln
+92.609 mln
5.25%
jan 1, 2012
2.21 bln
+354.685 mln
19.12%
jan 1, 2013
2.328 bln
+117.635 mln
5.32%
jan 1, 2014
2.546 bln
+218.709 mln
9.4%
jan 1, 2015
2.704 bln
+157.605 mln
6.19%
jan 1, 2016
2.423 bln
-280.467 mln
-10.37%
Ranking of countries by current statistics by years


Comments: