29
/
en
AIzaSyAYiBZKx7MnpbEhh9jyipgxe19OcubqV5w
April 1, 2024
194240
Mauritius
MUS
true
2
1
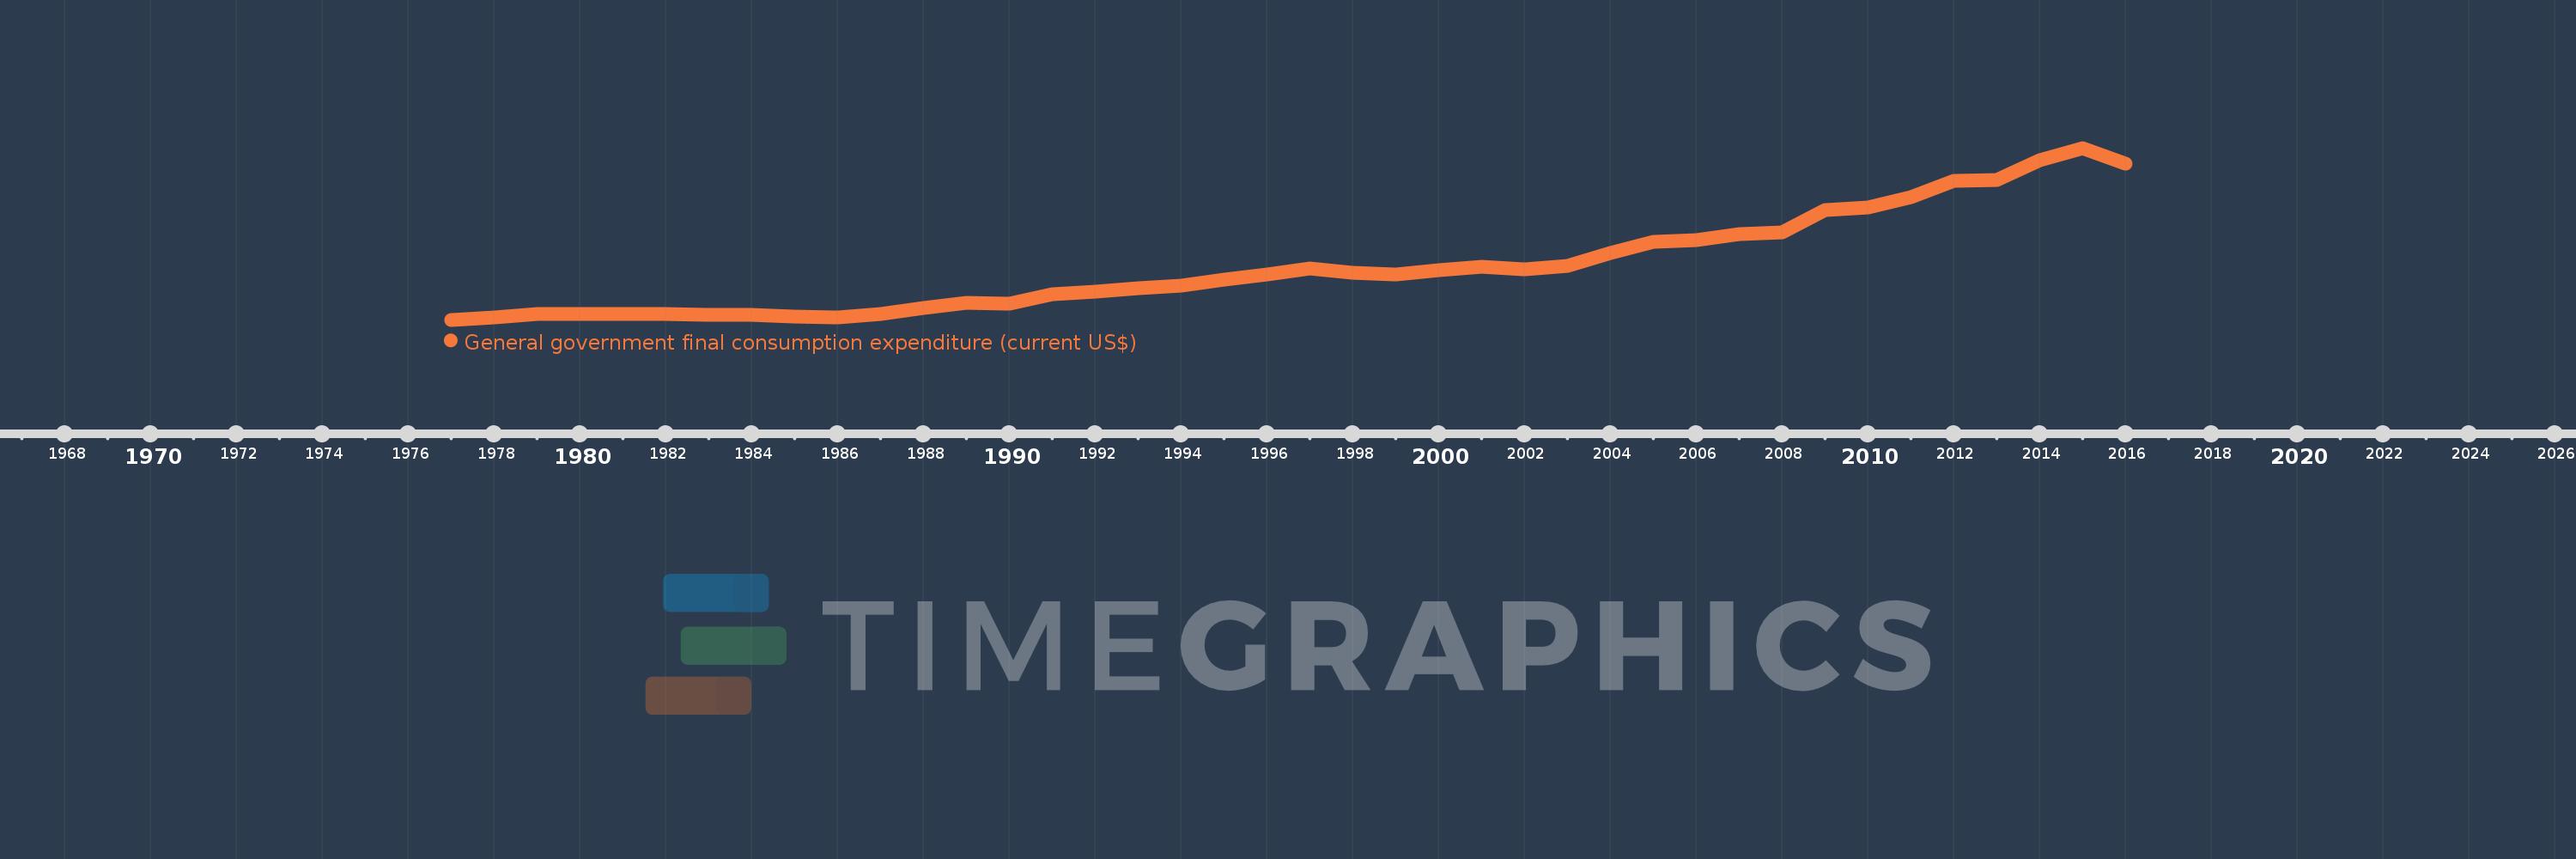
General government final consumption expenditure (current US$)
2016,2015,2014,2013,2012,2011,2010,2009,2008,2007,2006,2005,2004,2003,2002,2001,2000,1999,1998,1997,1996,1995,1994,1993,1992,1991,1990,1989,1988,1987,1986,1985,1984,1983,1982,1981,1980,1979,1978,1977
This statistics in other country:
AfghanistanAlbaniaAlgeriaAngolaAntigua and BarbudaArab WorldArgentinaArmeniaArubaAustraliaAustriaAzerbaijanBahamas, TheBahrainBangladeshBarbadosBelarusBelgiumBelizeBeninBermudaBhutanBoliviaBosnia and HerzegovinaBotswanaBrazilBrunei DarussalamBulgariaBurkina FasoBurundiCabo VerdeCambodiaCameroonCanadaCaribbean small statesCentral African RepublicCentral Europe and the BalticsChadChileChinaColombiaComorosCongo, Dem. Rep.Congo, Rep.Costa RicaCote d'IvoireCroatiaCubaCyprusCzech RepublicDenmarkDjiboutiDominicaDominican RepublicEarly-demographic dividendEast Asia & PacificEast Asia & Pacific (excluding high income)East Asia & Pacific (IDA & IBRD countries)EcuadorEgypt, Arab Rep.El SalvadorEquatorial GuineaEritreaEstoniaEthiopiaEuro areaEurope & Central AsiaEurope & Central Asia (excluding high income)Europe & Central Asia (IDA & IBRD countries)European UnionFaroe IslandsFijiFinlandFragile and conflict affected situationsFranceFrench PolynesiaGabonGambia, TheGeorgiaGermanyGhanaGreeceGrenadaGuatemalaGuineaGuinea-BissauGuyanaHaitiHeavily indebted poor countries (HIPC)High incomeHondurasHong Kong SAR, ChinaHungaryIBRD onlyIcelandIDA & IBRD totalIDA blendIDA onlyIDA totalIndiaIndonesiaIran, Islamic Rep.IraqIrelandIsraelItalyJamaicaJapanJordanKazakhstanKenyaKiribatiKorea, Rep.KosovoKuwaitKyrgyz RepublicLao PDRLate-demographic dividendLatin America & Caribbean Latin America & Caribbean (excluding high income)Latin America & the Caribbean (IDA & IBRD countries)LatviaLeast developed countries: UN classificationLebanonLesothoLiberiaLibyaLithuaniaLow & middle incomeLow incomeLower middle incomeLuxembourgMacao SAR, ChinaMacedonia, FYRMadagascarMalawiMalaysiaMaldivesMaliMaltaMauritaniaMauritiusMexicoMicronesia, Fed. Sts.Middle East & North AfricaMiddle East & North Africa (excluding high income)Middle East & North Africa (IDA & IBRD countries)Middle incomeMoldovaMongoliaMontenegroMoroccoMozambiqueNamibiaNepalNetherlandsNew CaledoniaNew ZealandNicaraguaNigerNigeriaNorth AmericaNorwayOECD membersOmanOther small statesPakistanPanamaPapua New GuineaParaguayPeruPhilippinesPolandPortugalPost-demographic dividendPre-demographic dividendPuerto RicoQatarRomaniaRussian FederationRwandaSaudi ArabiaSenegalSerbiaSeychellesSierra LeoneSingaporeSlovak RepublicSloveniaSmall statesSolomon IslandsSomaliaSouth AfricaSouth AsiaSouth Asia (IDA & IBRD)South SudanSpainSri LankaSt. Kitts and NevisSt. LuciaSt. Vincent and the GrenadinesSub-Saharan Africa Sub-Saharan Africa (excluding high income)Sub-Saharan Africa (IDA & IBRD countries)SudanSurinameSwazilandSwedenSwitzerlandSyrian Arab RepublicTajikistanTanzaniaThailandTimor-LesteTogoTongaTrinidad and TobagoTunisiaTurkeyTurkmenistanUgandaUkraineUnited Arab EmiratesUnited KingdomUnited StatesUpper middle incomeUruguayUzbekistanVanuatuVenezuela, RBVietnamWest Bank and GazaWorldYemen, Rep.ZambiaZimbabwe Timeline:
This timeline shows a graph from 1977 to 2016 of Mauritius. No data until 1976. Number of actual observations by date: 40.
Source name:
World Development Indicators
Source organization:
World Bank national accounts data, and OECD National Accounts data files.
Categories, topics:
Economy & Growth
Last updated:
apr 23, 2017
Indicators value changes by year
Minimum:
95.188 mln
jan 1, 1977
Maximum:
1.898 bln
jan 1, 2015
At the date of observation
Value
Absolute change
Change from previous value
jan 1, 1977
95.188 mln
+95.188 mln
0.0%
jan 1, 1978
120.776 mln
+25.587 mln
26.88%
jan 1, 1979
151.38 mln
+30.604 mln
25.34%
jan 1, 1980
159.953 mln
+8.573 mln
5.66%
jan 1, 1981
159.286 mln
-667.26K
-0.42%
jan 1, 1982
159.123 mln
-163.117K
-0.1%
jan 1, 1983
149.368 mln
-9.755 mln
-6.13%
jan 1, 1984
145.735 mln
-3.633 mln
-2.43%
jan 1, 1985
132.968 mln
-12.767 mln
-8.76%
jan 1, 1986
124.008 mln
-8.96 mln
-6.74%
jan 1, 1987
153.567 mln
+29.559 mln
23.84%
jan 1, 1988
220.139 mln
+66.572 mln
43.35%
jan 1, 1989
271.177 mln
+51.038 mln
23.18%
jan 1, 1990
267.413 mln
-3.764 mln
-1.39%
jan 1, 1991
359.74 mln
+92.327 mln
34.53%
jan 1, 1992
388.985 mln
+29.244 mln
8.13%
jan 1, 1993
429.216 mln
+40.231 mln
10.34%
jan 1, 1994
457.468 mln
+28.252 mln
6.58%
jan 1, 1995
519.854 mln
+62.385 mln
13.64%
jan 1, 1996
572.712 mln
+52.858 mln
10.17%
jan 1, 1997
634.439 mln
+61.727 mln
10.78%
jan 1, 1998
589.591 mln
-44.848 mln
-7.07%
jan 1, 1999
573.229 mln
-16.362 mln
-2.78%
jan 1, 2000
614.837 mln
+41.609 mln
7.26%
jan 1, 2001
647.092 mln
+32.254 mln
5.25%
jan 1, 2002
624.667 mln
-22.425 mln
-3.47%
jan 1, 2003
662.672 mln
+38.005 mln
6.08%
jan 1, 2004
798.22 mln
+135.548 mln
20.45%
jan 1, 2005
910.701 mln
+112.481 mln
14.09%
jan 1, 2006
927.836 mln
+17.135 mln
1.88%
jan 1, 2007
992.743 mln
+64.907 mln
7.0%
jan 1, 2008
1.014 bln
+20.775 mln
2.09%
jan 1, 2009
1.245 bln
+231.737 mln
22.86%
jan 1, 2010
1.271 bln
+25.685 mln
2.06%
jan 1, 2011
1.382 bln
+111.416 mln
8.77%
jan 1, 2012
1.551 bln
+168.435 mln
12.18%
jan 1, 2013
1.559 bln
+7.878 mln
0.51%
jan 1, 2014
1.772 bln
+212.846 mln
13.66%
jan 1, 2015
1.898 bln
+126.295 mln
7.13%
jan 1, 2016
1.731 bln
-166.729 mln
-8.79%
Ranking of countries by current statistics by years


Comments: