29
/
en
AIzaSyAYiBZKx7MnpbEhh9jyipgxe19OcubqV5w
April 1, 2024
190250
Mali
MLI
true
2
1
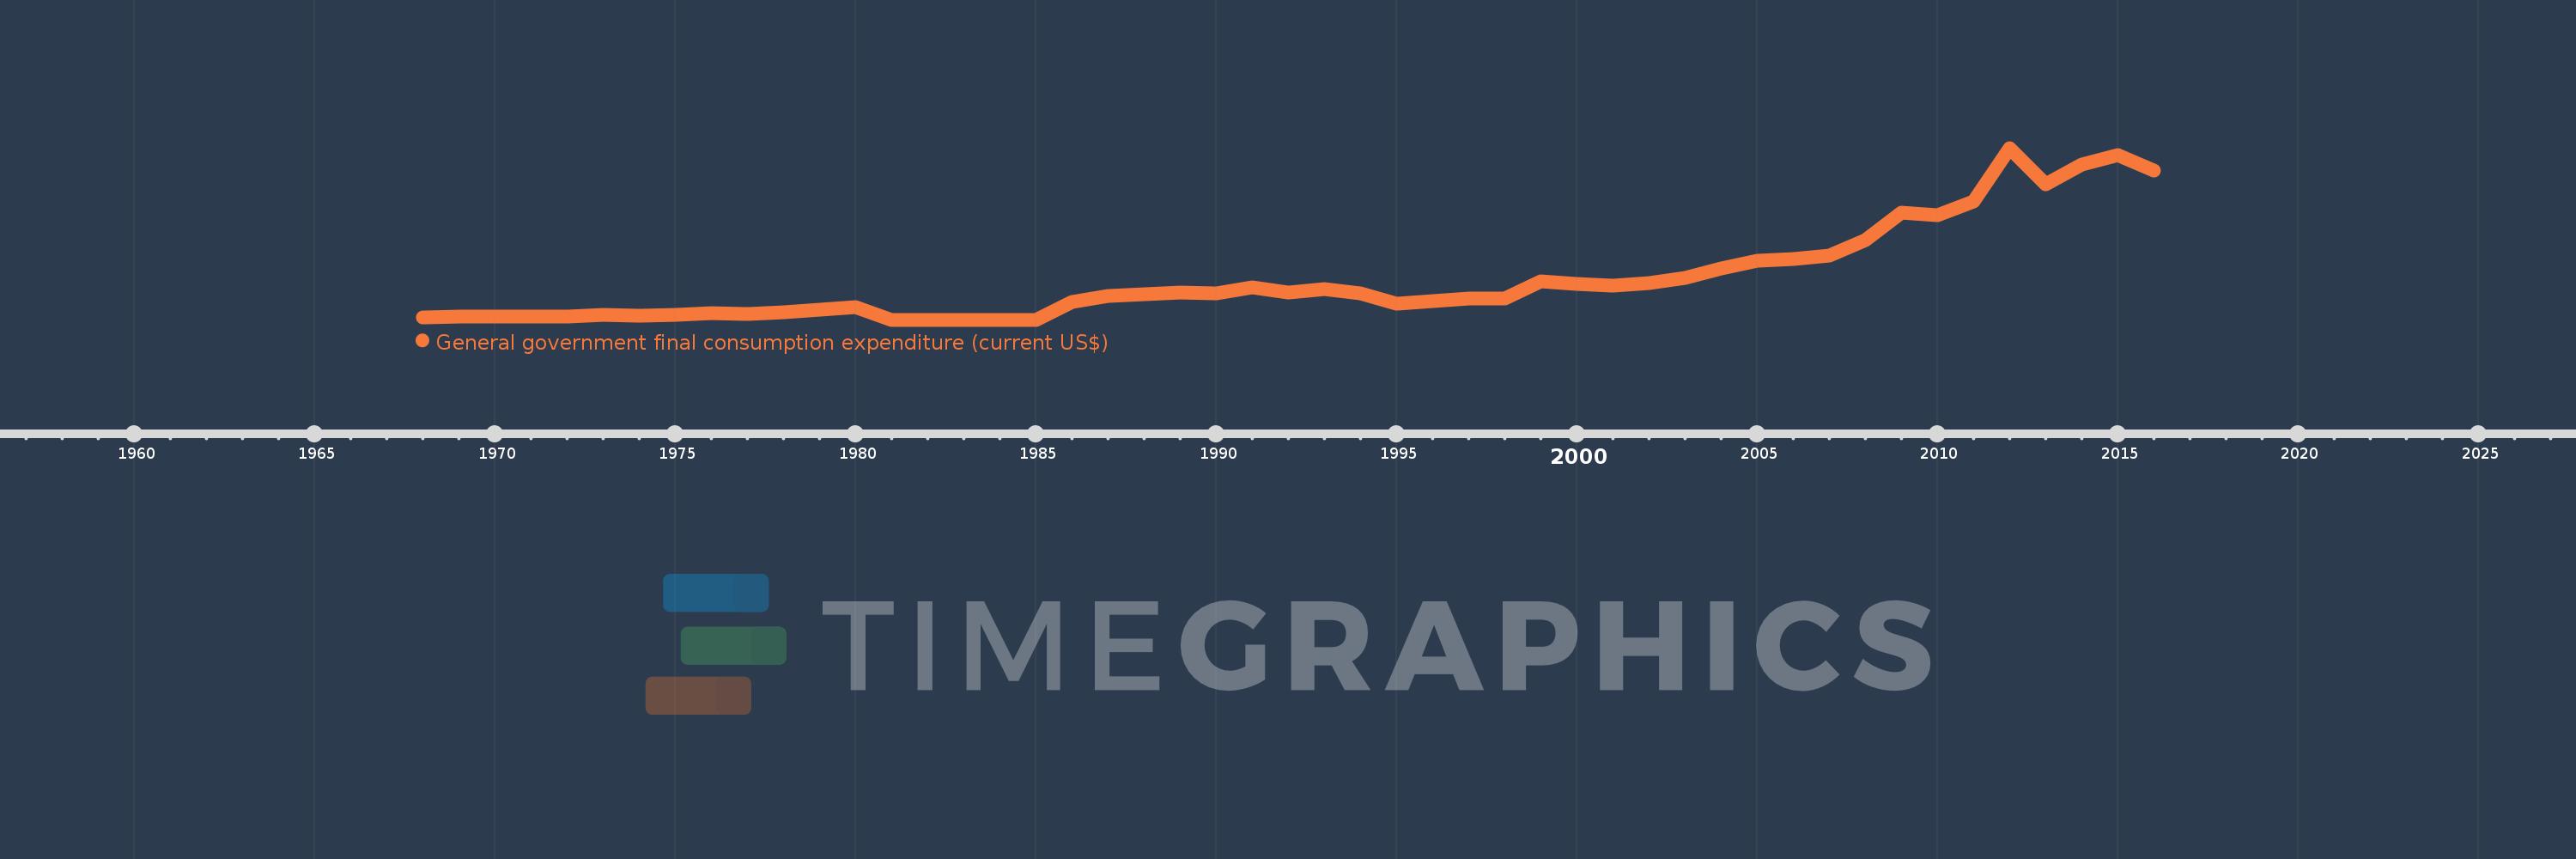
General government final consumption expenditure (current US$)
2016,2015,2014,2013,2012,2011,2010,2009,2008,2007,2006,2005,2004,2003,2002,2001,2000,1999,1998,1997,1996,1995,1994,1993,1992,1991,1990,1989,1988,1987,1986,1985,1984,1983,1982,1981,1980,1979,1978,1977,1976,1975,1974,1973,1972,1971,1970,1969,1968
This statistics in other country:
AfghanistanAlbaniaAlgeriaAngolaAntigua and BarbudaArab WorldArgentinaArmeniaArubaAustraliaAustriaAzerbaijanBahamas, TheBahrainBangladeshBarbadosBelarusBelgiumBelizeBeninBermudaBhutanBoliviaBosnia and HerzegovinaBotswanaBrazilBrunei DarussalamBulgariaBurkina FasoBurundiCabo VerdeCambodiaCameroonCanadaCaribbean small statesCentral African RepublicCentral Europe and the BalticsChadChileChinaColombiaComorosCongo, Dem. Rep.Congo, Rep.Costa RicaCote d'IvoireCroatiaCubaCyprusCzech RepublicDenmarkDjiboutiDominicaDominican RepublicEarly-demographic dividendEast Asia & PacificEast Asia & Pacific (excluding high income)East Asia & Pacific (IDA & IBRD countries)EcuadorEgypt, Arab Rep.El SalvadorEquatorial GuineaEritreaEstoniaEthiopiaEuro areaEurope & Central AsiaEurope & Central Asia (excluding high income)Europe & Central Asia (IDA & IBRD countries)European UnionFaroe IslandsFijiFinlandFragile and conflict affected situationsFranceFrench PolynesiaGabonGambia, TheGeorgiaGermanyGhanaGreeceGrenadaGuatemalaGuineaGuinea-BissauGuyanaHaitiHeavily indebted poor countries (HIPC)High incomeHondurasHong Kong SAR, ChinaHungaryIBRD onlyIcelandIDA & IBRD totalIDA blendIDA onlyIDA totalIndiaIndonesiaIran, Islamic Rep.IraqIrelandIsraelItalyJamaicaJapanJordanKazakhstanKenyaKiribatiKorea, Rep.KosovoKuwaitKyrgyz RepublicLao PDRLate-demographic dividendLatin America & Caribbean Latin America & Caribbean (excluding high income)Latin America & the Caribbean (IDA & IBRD countries)LatviaLeast developed countries: UN classificationLebanonLesothoLiberiaLibyaLithuaniaLow & middle incomeLow incomeLower middle incomeLuxembourgMacao SAR, ChinaMacedonia, FYRMadagascarMalawiMalaysiaMaldivesMaliMaltaMauritaniaMauritiusMexicoMicronesia, Fed. Sts.Middle East & North AfricaMiddle East & North Africa (excluding high income)Middle East & North Africa (IDA & IBRD countries)Middle incomeMoldovaMongoliaMontenegroMoroccoMozambiqueNamibiaNepalNetherlandsNew CaledoniaNew ZealandNicaraguaNigerNigeriaNorth AmericaNorwayOECD membersOmanOther small statesPakistanPanamaPapua New GuineaParaguayPeruPhilippinesPolandPortugalPost-demographic dividendPre-demographic dividendPuerto RicoQatarRomaniaRussian FederationRwandaSaudi ArabiaSenegalSerbiaSeychellesSierra LeoneSingaporeSlovak RepublicSloveniaSmall statesSolomon IslandsSomaliaSouth AfricaSouth AsiaSouth Asia (IDA & IBRD)South SudanSpainSri LankaSt. Kitts and NevisSt. LuciaSt. Vincent and the GrenadinesSub-Saharan Africa Sub-Saharan Africa (excluding high income)Sub-Saharan Africa (IDA & IBRD countries)SudanSurinameSwazilandSwedenSwitzerlandSyrian Arab RepublicTajikistanTanzaniaThailandTimor-LesteTogoTongaTrinidad and TobagoTunisiaTurkeyTurkmenistanUgandaUkraineUnited Arab EmiratesUnited KingdomUnited StatesUpper middle incomeUruguayUzbekistanVanuatuVenezuela, RBVietnamWest Bank and GazaWorldYemen, Rep.ZambiaZimbabwe Timeline:
This timeline shows a graph from 1968 to 2016 of Mali. No data until 1967. Number of actual observations by date: 49.
Source name:
World Development Indicators
Source organization:
World Bank national accounts data, and OECD National Accounts data files.
Categories, topics:
Economy & Growth
Last updated:
apr 23, 2017
Indicators value changes by year
Maximum:
2.439 bln
jan 1, 2012
At the date of observation
Value
Absolute change
Change from previous value
jan 1, 1968
32.765 mln
+32.765 mln
0.0%
jan 1, 1969
40.219 mln
+7.454 mln
22.75%
jan 1, 1970
40.855 mln
+635.633K
1.58%
jan 1, 1971
40.826 mln
-28.773K
-0.07%
jan 1, 1972
49.844 mln
+9.018 mln
22.09%
jan 1, 1973
65.092 mln
+15.248 mln
30.59%
jan 1, 1974
54.457 mln
-10.635 mln
-16.34%
jan 1, 1975
72.488 mln
+18.03 mln
33.11%
jan 1, 1976
97.786 mln
+25.298 mln
34.9%
jan 1, 1977
84.131 mln
-13.654 mln
-13.96%
jan 1, 1978
111.161 mln
+27.03 mln
32.13%
jan 1, 1979
144.138 mln
+32.977 mln
29.67%
jan 1, 1980
182.17 mln
+38.032 mln
26.39%
jan 1, 1981
0.0
-182.17 mln
-100.0%
jan 1, 1986
256.752 mln
+256.752 mln
%
jan 1, 1987
339.206 mln
+82.454 mln
32.11%
jan 1, 1988
358.861 mln
+19.656 mln
5.79%
jan 1, 1989
383.148 mln
+24.287 mln
6.77%
jan 1, 1990
371.73 mln
-11.418 mln
-2.98%
jan 1, 1991
456.879 mln
+85.149 mln
22.91%
jan 1, 1992
388.363 mln
-68.515 mln
-15.0%
jan 1, 1993
430.07 mln
+41.707 mln
10.74%
jan 1, 1994
372.881 mln
-57.189 mln
-13.3%
jan 1, 1995
224.78 mln
-148.101 mln
-39.72%
jan 1, 1996
267.199 mln
+42.419 mln
18.87%
jan 1, 1997
305.361 mln
+38.162 mln
14.28%
jan 1, 1998
302.123 mln
-3.238 mln
-1.06%
jan 1, 1999
547.331 mln
+245.208 mln
81.16%
jan 1, 2000
505.073 mln
-42.258 mln
-7.72%
jan 1, 2001
484.992 mln
-20.081 mln
-3.98%
jan 1, 2002
519.739 mln
+34.747 mln
7.16%
jan 1, 2003
597.494 mln
+77.755 mln
14.96%
jan 1, 2004
732.174 mln
+134.679 mln
22.54%
jan 1, 2005
841.766 mln
+109.592 mln
14.97%
jan 1, 2006
864.714 mln
+22.948 mln
2.73%
jan 1, 2007
915.068 mln
+50.354 mln
5.82%
jan 1, 2008
1.136 bln
+220.911 mln
24.14%
jan 1, 2009
1.518 bln
+381.96 mln
33.62%
jan 1, 2010
1.483 bln
-34.573 mln
-2.28%
jan 1, 2011
1.675 bln
+191.879 mln
12.94%
jan 1, 2012
2.439 bln
+763.753 mln
45.59%
jan 1, 2013
1.927 bln
-512.308 mln
-21.0%
jan 1, 2014
2.209 bln
+282.587 mln
14.67%
jan 1, 2015
2.34 bln
+131.199 mln
5.94%
jan 1, 2016
2.121 bln
-219.378 mln
-9.37%
Ranking of countries by current statistics by years


Comments: