29
/
en
AIzaSyAYiBZKx7MnpbEhh9jyipgxe19OcubqV5w
April 1, 2024
250790
St. Lucia
LCA
true
2
1
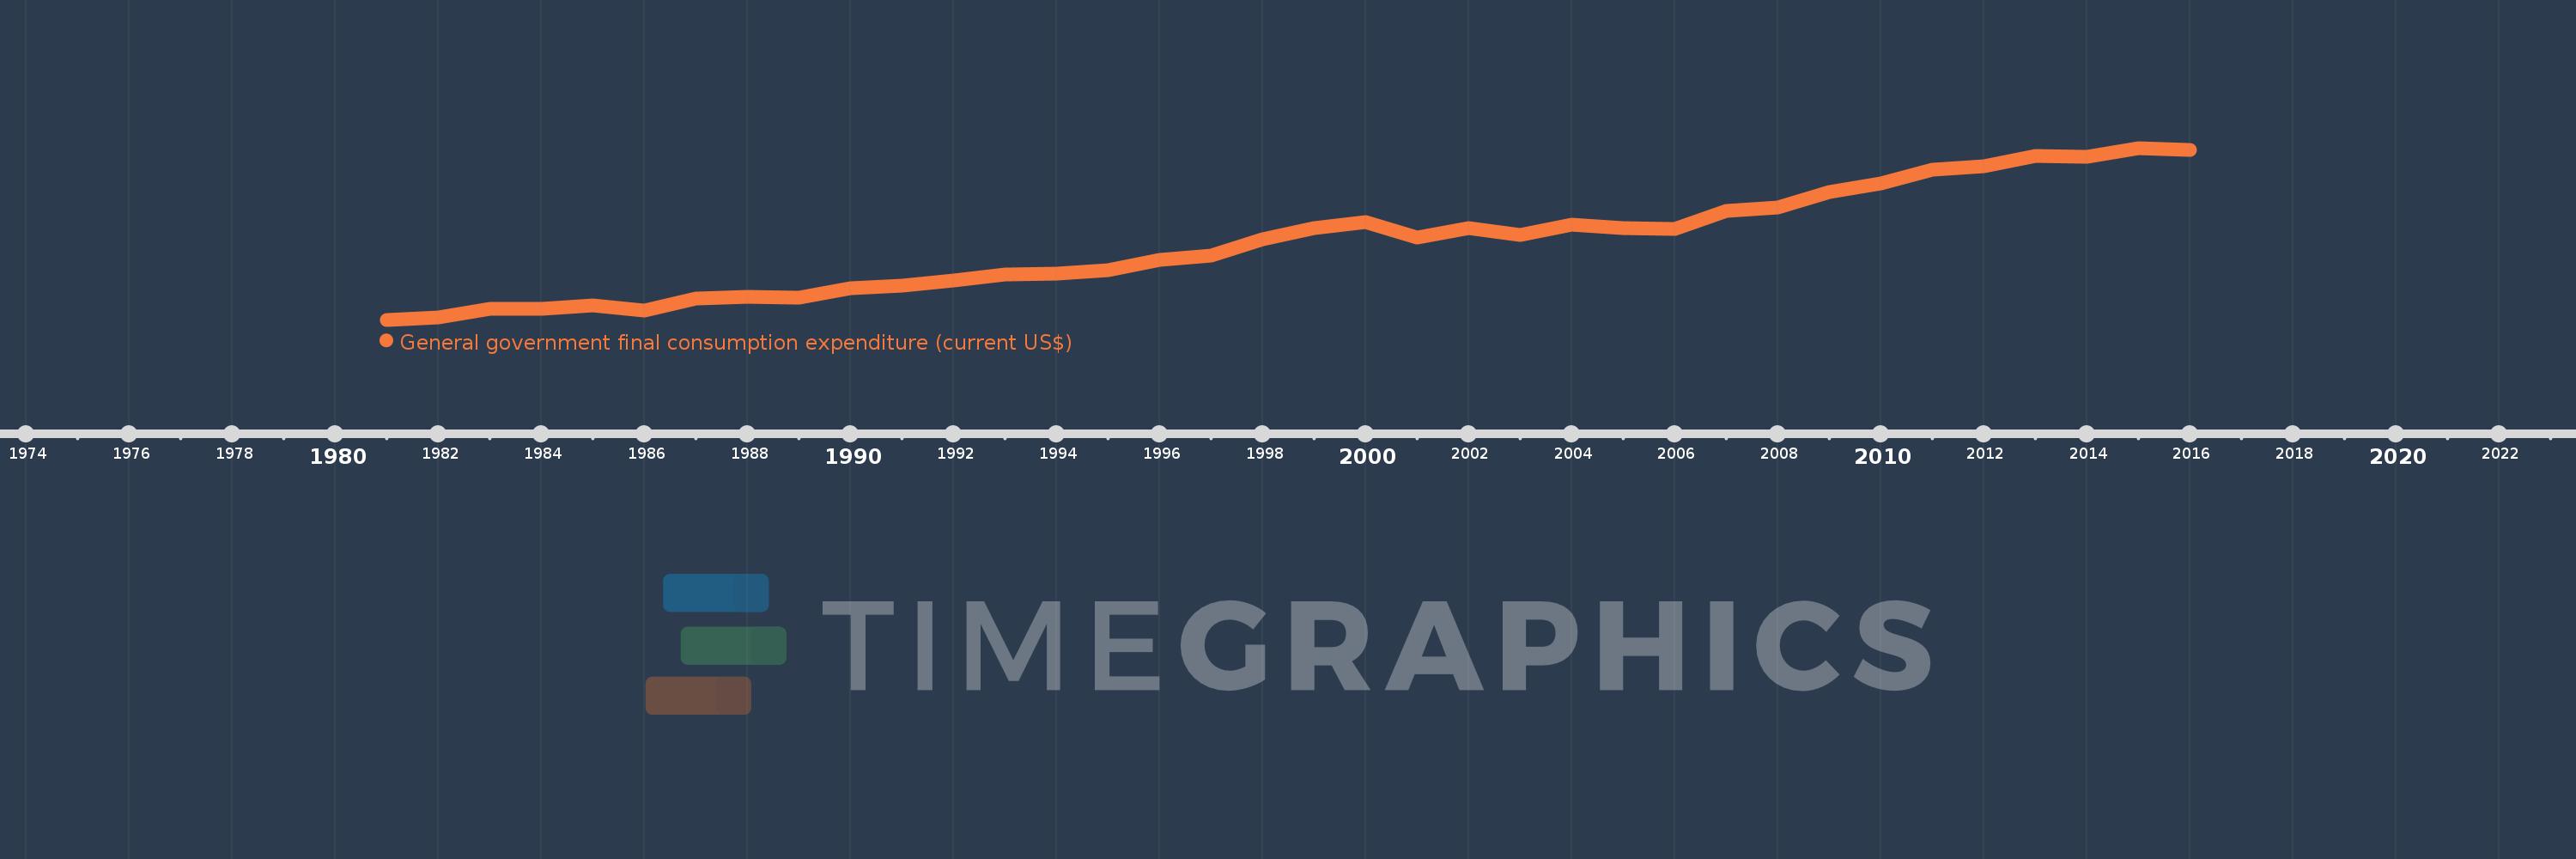
General government final consumption expenditure (current US$)
2016,2015,2014,2013,2012,2011,2010,2009,2008,2007,2006,2005,2004,2003,2002,2001,2000,1999,1998,1997,1996,1995,1994,1993,1992,1991,1990,1989,1988,1987,1986,1985,1984,1983,1982,1981
This statistics in other country:
AfghanistanAlbaniaAlgeriaAngolaAntigua and BarbudaArab WorldArgentinaArmeniaArubaAustraliaAustriaAzerbaijanBahamas, TheBahrainBangladeshBarbadosBelarusBelgiumBelizeBeninBermudaBhutanBoliviaBosnia and HerzegovinaBotswanaBrazilBrunei DarussalamBulgariaBurkina FasoBurundiCabo VerdeCambodiaCameroonCanadaCaribbean small statesCentral African RepublicCentral Europe and the BalticsChadChileChinaColombiaComorosCongo, Dem. Rep.Congo, Rep.Costa RicaCote d'IvoireCroatiaCubaCyprusCzech RepublicDenmarkDjiboutiDominicaDominican RepublicEarly-demographic dividendEast Asia & PacificEast Asia & Pacific (excluding high income)East Asia & Pacific (IDA & IBRD countries)EcuadorEgypt, Arab Rep.El SalvadorEquatorial GuineaEritreaEstoniaEthiopiaEuro areaEurope & Central AsiaEurope & Central Asia (excluding high income)Europe & Central Asia (IDA & IBRD countries)European UnionFaroe IslandsFijiFinlandFragile and conflict affected situationsFranceFrench PolynesiaGabonGambia, TheGeorgiaGermanyGhanaGreeceGrenadaGuatemalaGuineaGuinea-BissauGuyanaHaitiHeavily indebted poor countries (HIPC)High incomeHondurasHong Kong SAR, ChinaHungaryIBRD onlyIcelandIDA & IBRD totalIDA blendIDA onlyIDA totalIndiaIndonesiaIran, Islamic Rep.IraqIrelandIsraelItalyJamaicaJapanJordanKazakhstanKenyaKiribatiKorea, Rep.KosovoKuwaitKyrgyz RepublicLao PDRLate-demographic dividendLatin America & Caribbean Latin America & Caribbean (excluding high income)Latin America & the Caribbean (IDA & IBRD countries)LatviaLeast developed countries: UN classificationLebanonLesothoLiberiaLibyaLithuaniaLow & middle incomeLow incomeLower middle incomeLuxembourgMacao SAR, ChinaMacedonia, FYRMadagascarMalawiMalaysiaMaldivesMaliMaltaMauritaniaMauritiusMexicoMicronesia, Fed. Sts.Middle East & North AfricaMiddle East & North Africa (excluding high income)Middle East & North Africa (IDA & IBRD countries)Middle incomeMoldovaMongoliaMontenegroMoroccoMozambiqueNamibiaNepalNetherlandsNew CaledoniaNew ZealandNicaraguaNigerNigeriaNorth AmericaNorwayOECD membersOmanOther small statesPakistanPanamaPapua New GuineaParaguayPeruPhilippinesPolandPortugalPost-demographic dividendPre-demographic dividendPuerto RicoQatarRomaniaRussian FederationRwandaSaudi ArabiaSenegalSerbiaSeychellesSierra LeoneSingaporeSlovak RepublicSloveniaSmall statesSolomon IslandsSomaliaSouth AfricaSouth AsiaSouth Asia (IDA & IBRD)South SudanSpainSri LankaSt. Kitts and NevisSt. LuciaSt. Vincent and the GrenadinesSub-Saharan Africa Sub-Saharan Africa (excluding high income)Sub-Saharan Africa (IDA & IBRD countries)SudanSurinameSwazilandSwedenSwitzerlandSyrian Arab RepublicTajikistanTanzaniaThailandTimor-LesteTogoTongaTrinidad and TobagoTunisiaTurkeyTurkmenistanUgandaUkraineUnited Arab EmiratesUnited KingdomUnited StatesUpper middle incomeUruguayUzbekistanVanuatuVenezuela, RBVietnamWest Bank and GazaWorldYemen, Rep.ZambiaZimbabwe Timeline:
This timeline shows a graph from 1981 to 2016 of St. Lucia. No data until 1980. Number of actual observations by date: 36.
Source name:
World Development Indicators
Source organization:
World Bank national accounts data, and OECD National Accounts data files.
Categories, topics:
Economy & Growth
Last updated:
apr 23, 2017
Indicators value changes by year
Minimum:
23.407 mln
jan 1, 1981
Maximum:
198.319 mln
jan 1, 2015
At the date of observation
Value
Absolute change
Change from previous value
jan 1, 1981
23.407 mln
+23.407 mln
0.0%
jan 1, 1982
25.852 mln
+2.444 mln
10.44%
jan 1, 1983
34.519 mln
+8.667 mln
33.52%
jan 1, 1984
34.593 mln
+74.074K
0.21%
jan 1, 1985
37.815 mln
+3.222 mln
9.31%
jan 1, 1986
32.815 mln
-5.0 mln
-13.22%
jan 1, 1987
45.148 mln
+12.333 mln
37.58%
jan 1, 1988
46.481 mln
+1.333 mln
2.95%
jan 1, 1989
46.296 mln
-185.185K
-0.4%
jan 1, 1990
55.704 mln
+9.407 mln
20.32%
jan 1, 1991
58.481 mln
+2.778 mln
4.99%
jan 1, 1992
63.0 mln
+4.519 mln
7.73%
jan 1, 1993
69.63 mln
+6.63 mln
10.52%
jan 1, 1994
70.444 mln
+814.815K
1.17%
jan 1, 1995
74.259 mln
+3.815 mln
5.42%
jan 1, 1996
84.667 mln
+10.407 mln
14.01%
jan 1, 1997
88.407 mln
+3.741 mln
4.42%
jan 1, 1998
105.215 mln
+16.807 mln
19.01%
jan 1, 1999
116.537 mln
+11.322 mln
10.76%
jan 1, 2000
122.537 mln
+6.0 mln
5.15%
jan 1, 2001
107.211 mln
-15.326 mln
-12.51%
jan 1, 2002
116.707 mln
+9.496 mln
8.86%
jan 1, 2003
109.719 mln
-6.989 mln
-5.99%
jan 1, 2004
120.259 mln
+10.541 mln
9.61%
jan 1, 2005
116.293 mln
-3.967 mln
-3.3%
jan 1, 2006
116.122 mln
-170.37K
-0.15%
jan 1, 2007
134.6 mln
+18.478 mln
15.91%
jan 1, 2008
138.05 mln
+3.45 mln
2.56%
jan 1, 2009
153.292 mln
+15.242 mln
11.04%
jan 1, 2010
162.538 mln
+9.246 mln
6.03%
jan 1, 2011
176.288 mln
+13.75 mln
8.46%
jan 1, 2012
179.534 mln
+3.246 mln
1.84%
jan 1, 2013
189.978 mln
+10.444 mln
5.82%
jan 1, 2014
189.684 mln
-294.111K
-0.15%
jan 1, 2015
198.319 mln
+8.635 mln
4.55%
jan 1, 2016
196.588 mln
-1.731 mln
-0.87%
Ranking of countries by current statistics by years


Comments: