29
/
en
AIzaSyAYiBZKx7MnpbEhh9jyipgxe19OcubqV5w
April 1, 2024
225915
Portugal
PRT
true
2
1
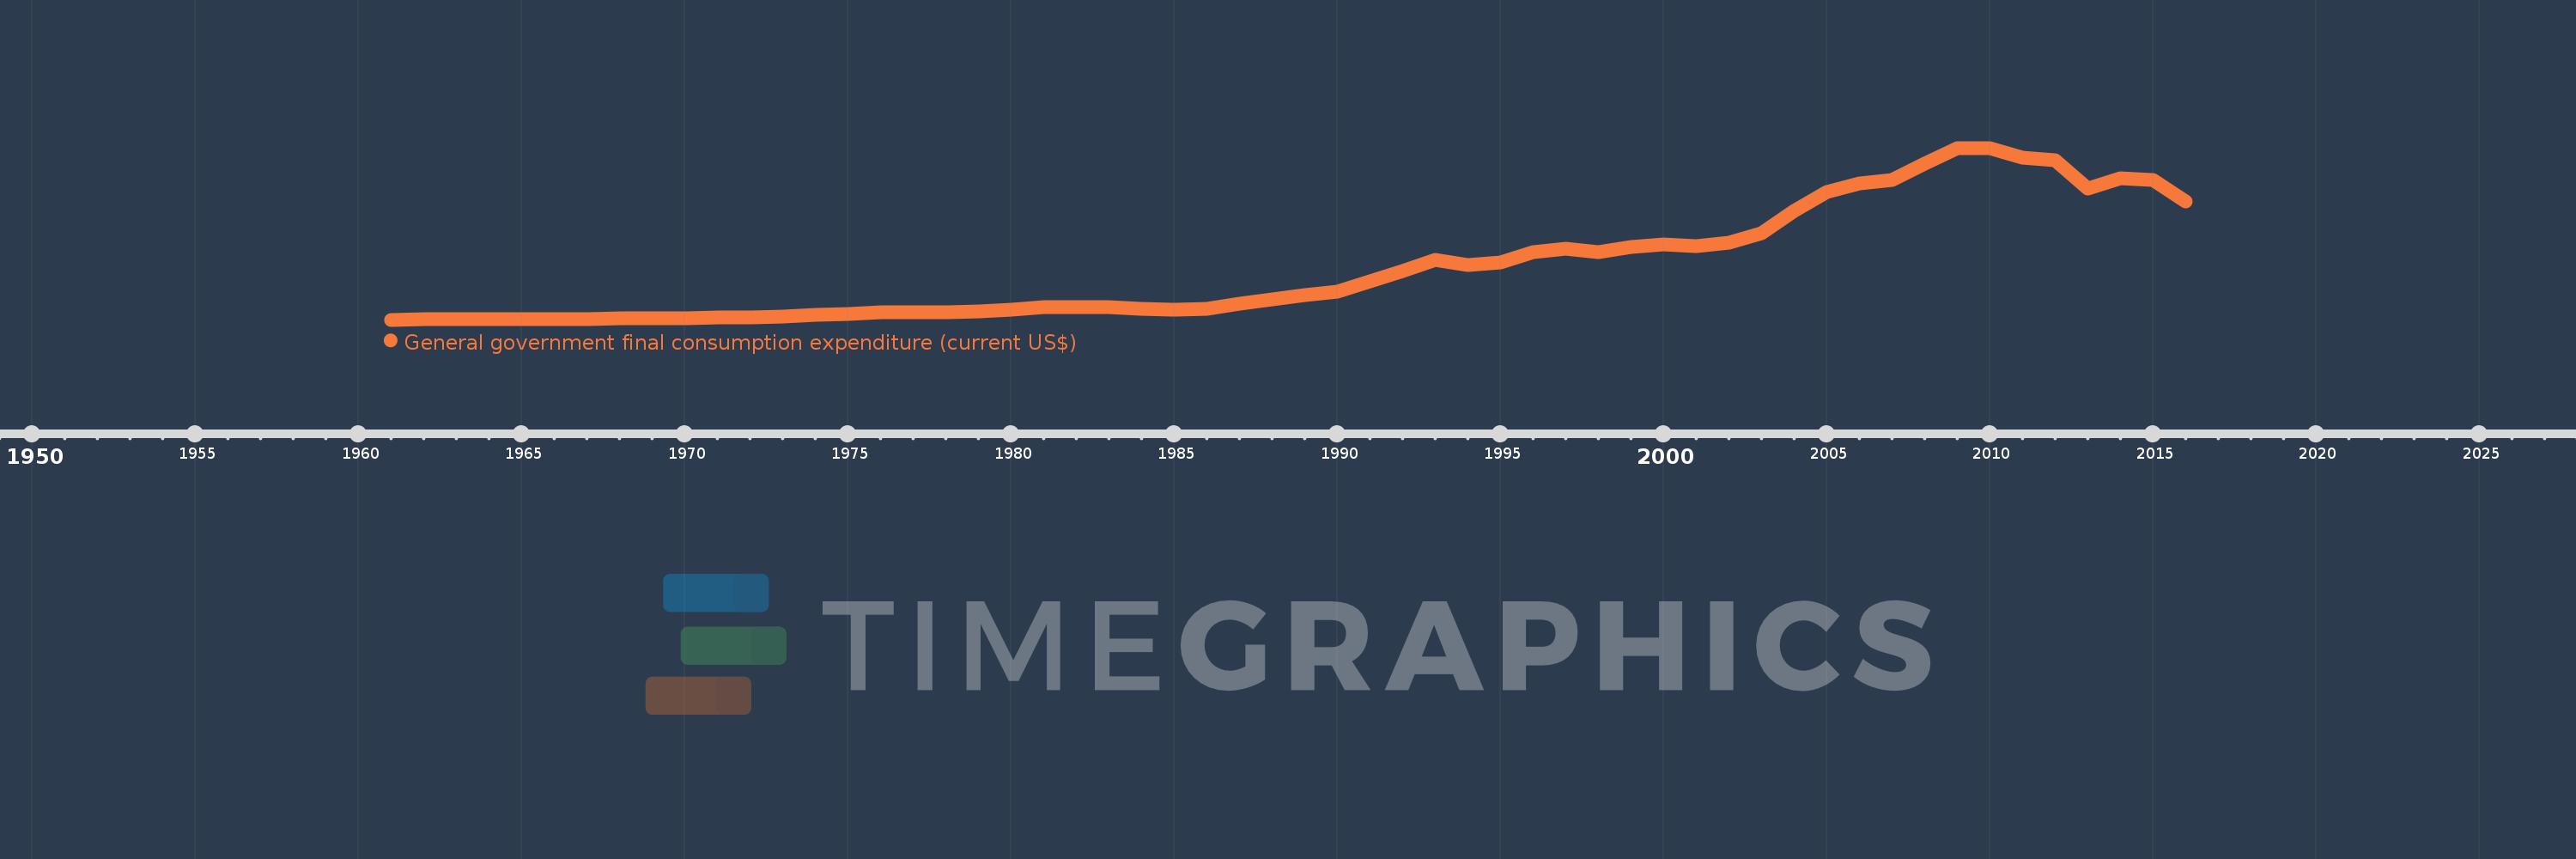
General government final consumption expenditure (current US$)
2016,2015,2014,2013,2012,2011,2010,2009,2008,2007,2006,2005,2004,2003,2002,2001,2000,1999,1998,1997,1996,1995,1994,1993,1992,1991,1990,1989,1988,1987,1986,1985,1984,1983,1982,1981,1980,1979,1978,1977,1976,1975,1974,1973,1972,1971,1970,1969,1968,1967,1966,1965,1964,1963,1962,1961
This statistics in other country:
AfghanistanAlbaniaAlgeriaAngolaAntigua and BarbudaArab WorldArgentinaArmeniaArubaAustraliaAustriaAzerbaijanBahamas, TheBahrainBangladeshBarbadosBelarusBelgiumBelizeBeninBermudaBhutanBoliviaBosnia and HerzegovinaBotswanaBrazilBrunei DarussalamBulgariaBurkina FasoBurundiCabo VerdeCambodiaCameroonCanadaCaribbean small statesCentral African RepublicCentral Europe and the BalticsChadChileChinaColombiaComorosCongo, Dem. Rep.Congo, Rep.Costa RicaCote d'IvoireCroatiaCubaCyprusCzech RepublicDenmarkDjiboutiDominicaDominican RepublicEarly-demographic dividendEast Asia & PacificEast Asia & Pacific (excluding high income)East Asia & Pacific (IDA & IBRD countries)EcuadorEgypt, Arab Rep.El SalvadorEquatorial GuineaEritreaEstoniaEthiopiaEuro areaEurope & Central AsiaEurope & Central Asia (excluding high income)Europe & Central Asia (IDA & IBRD countries)European UnionFaroe IslandsFijiFinlandFragile and conflict affected situationsFranceFrench PolynesiaGabonGambia, TheGeorgiaGermanyGhanaGreeceGrenadaGuatemalaGuineaGuinea-BissauGuyanaHaitiHeavily indebted poor countries (HIPC)High incomeHondurasHong Kong SAR, ChinaHungaryIBRD onlyIcelandIDA & IBRD totalIDA blendIDA onlyIDA totalIndiaIndonesiaIran, Islamic Rep.IraqIrelandIsraelItalyJamaicaJapanJordanKazakhstanKenyaKiribatiKorea, Rep.KosovoKuwaitKyrgyz RepublicLao PDRLate-demographic dividendLatin America & Caribbean Latin America & Caribbean (excluding high income)Latin America & the Caribbean (IDA & IBRD countries)LatviaLeast developed countries: UN classificationLebanonLesothoLiberiaLibyaLithuaniaLow & middle incomeLow incomeLower middle incomeLuxembourgMacao SAR, ChinaMacedonia, FYRMadagascarMalawiMalaysiaMaldivesMaliMaltaMauritaniaMauritiusMexicoMicronesia, Fed. Sts.Middle East & North AfricaMiddle East & North Africa (excluding high income)Middle East & North Africa (IDA & IBRD countries)Middle incomeMoldovaMongoliaMontenegroMoroccoMozambiqueNamibiaNepalNetherlandsNew CaledoniaNew ZealandNicaraguaNigerNigeriaNorth AmericaNorwayOECD membersOmanOther small statesPakistanPanamaPapua New GuineaParaguayPeruPhilippinesPolandPortugalPost-demographic dividendPre-demographic dividendPuerto RicoQatarRomaniaRussian FederationRwandaSaudi ArabiaSenegalSerbiaSeychellesSierra LeoneSingaporeSlovak RepublicSloveniaSmall statesSolomon IslandsSomaliaSouth AfricaSouth AsiaSouth Asia (IDA & IBRD)South SudanSpainSri LankaSt. Kitts and NevisSt. LuciaSt. Vincent and the GrenadinesSub-Saharan Africa Sub-Saharan Africa (excluding high income)Sub-Saharan Africa (IDA & IBRD countries)SudanSurinameSwazilandSwedenSwitzerlandSyrian Arab RepublicTajikistanTanzaniaThailandTimor-LesteTogoTongaTrinidad and TobagoTunisiaTurkeyTurkmenistanUgandaUkraineUnited Arab EmiratesUnited KingdomUnited StatesUpper middle incomeUruguayUzbekistanVanuatuVenezuela, RBVietnamWest Bank and GazaWorldYemen, Rep.ZambiaZimbabwe Timeline:
This timeline shows a graph from 1961 to 2016 of Portugal. No data until 1960. Number of actual observations by date: 56.
Source name:
World Development Indicators
Source organization:
World Bank national accounts data, and OECD National Accounts data files.
Categories, topics:
Economy & Growth
Last updated:
apr 23, 2017
Indicators value changes by year
Minimum:
292.475 mln
jan 1, 1961
Maximum:
52.242 bln
jan 1, 2010
At the date of observation
Value
Absolute change
Change from previous value
jan 1, 1961
292.475 mln
+292.475 mln
0.0%
jan 1, 1962
370.468 mln
+77.993 mln
26.67%
jan 1, 1963
409.464 mln
+38.997 mln
10.53%
jan 1, 1964
425.063 mln
+15.599 mln
3.81%
jan 1, 1965
460.16 mln
+35.097 mln
8.26%
jan 1, 1966
498.72 mln
+38.56 mln
8.38%
jan 1, 1967
553.475 mln
+54.756 mln
10.98%
jan 1, 1968
667.665 mln
+114.19 mln
20.63%
jan 1, 1969
739.839 mln
+72.174 mln
10.81%
jan 1, 1970
801.622 mln
+61.783 mln
8.35%
jan 1, 1971
981.493 mln
+179.871 mln
22.44%
jan 1, 1972
1.089 bln
+107.938 mln
11.0%
jan 1, 1973
1.316 bln
+226.508 mln
20.79%
jan 1, 1974
1.692 bln
+375.587 mln
28.54%
jan 1, 1975
2.162 bln
+470.616 mln
27.82%
jan 1, 1976
2.535 bln
+373.287 mln
17.26%
jan 1, 1977
2.445 bln
-90.841 mln
-3.58%
jan 1, 1978
2.634 bln
+189.69 mln
7.76%
jan 1, 1979
2.864 bln
+229.82 mln
8.72%
jan 1, 1980
3.228 bln
+363.604 mln
12.7%
jan 1, 1981
4.186 bln
+958.709 mln
29.7%
jan 1, 1982
4.212 bln
+25.732 mln
0.61%
jan 1, 1983
3.988 bln
-223.955 mln
-5.32%
jan 1, 1984
3.609 bln
-379.48 mln
-9.52%
jan 1, 1985
3.317 bln
-291.909 mln
-8.09%
jan 1, 1986
3.684 bln
+366.864 mln
11.06%
jan 1, 1987
5.208 bln
+1.525 bln
41.39%
jan 1, 1988
6.395 bln
+1.187 bln
22.78%
jan 1, 1989
7.766 bln
+1.371 bln
21.43%
jan 1, 1990
8.786 bln
+1.02 bln
13.13%
jan 1, 1991
12.031 bln
+3.245 bln
36.94%
jan 1, 1992
15.143 bln
+3.112 bln
25.87%
jan 1, 1993
18.289 bln
+3.146 bln
20.78%
jan 1, 1994
16.711 bln
-1.578 bln
-8.63%
jan 1, 1995
17.591 bln
+880.35 mln
5.27%
jan 1, 1996
20.749 bln
+3.158 bln
17.95%
jan 1, 1997
21.812 bln
+1.063 bln
5.12%
jan 1, 1998
20.764 bln
-1.047 bln
-4.8%
jan 1, 1999
22.28 bln
+1.515 bln
7.3%
jan 1, 2000
23.157 bln
+877.103 mln
3.94%
jan 1, 2001
22.515 bln
-642.409 mln
-2.77%
jan 1, 2002
23.568 bln
+1.054 bln
4.68%
jan 1, 2003
26.422 bln
+2.853 bln
12.11%
jan 1, 2004
33.317 bln
+6.895 bln
26.1%
jan 1, 2005
38.866 bln
+5.55 bln
16.66%
jan 1, 2006
41.608 bln
+2.742 bln
7.05%
jan 1, 2007
42.676 bln
+1.068 bln
2.57%
jan 1, 2008
47.469 bln
+4.793 bln
11.23%
jan 1, 2009
52.15 bln
+4.681 bln
9.86%
jan 1, 2010
52.242 bln
+91.694 mln
0.18%
jan 1, 2011
49.364 bln
-2.878 bln
-5.51%
jan 1, 2012
48.629 bln
-735.722 mln
-1.49%
jan 1, 2013
40.058 bln
-8.571 bln
-17.62%
jan 1, 2014
43.152 bln
+3.095 bln
7.73%
jan 1, 2015
42.675 bln
-477.44 mln
-1.11%
jan 1, 2016
36.081 bln
-6.594 bln
-15.45%
Ranking of countries by current statistics by years


Comments: