29
/
en
AIzaSyAYiBZKx7MnpbEhh9jyipgxe19OcubqV5w
April 1, 2024
265784
Tonga
TON
true
2
1
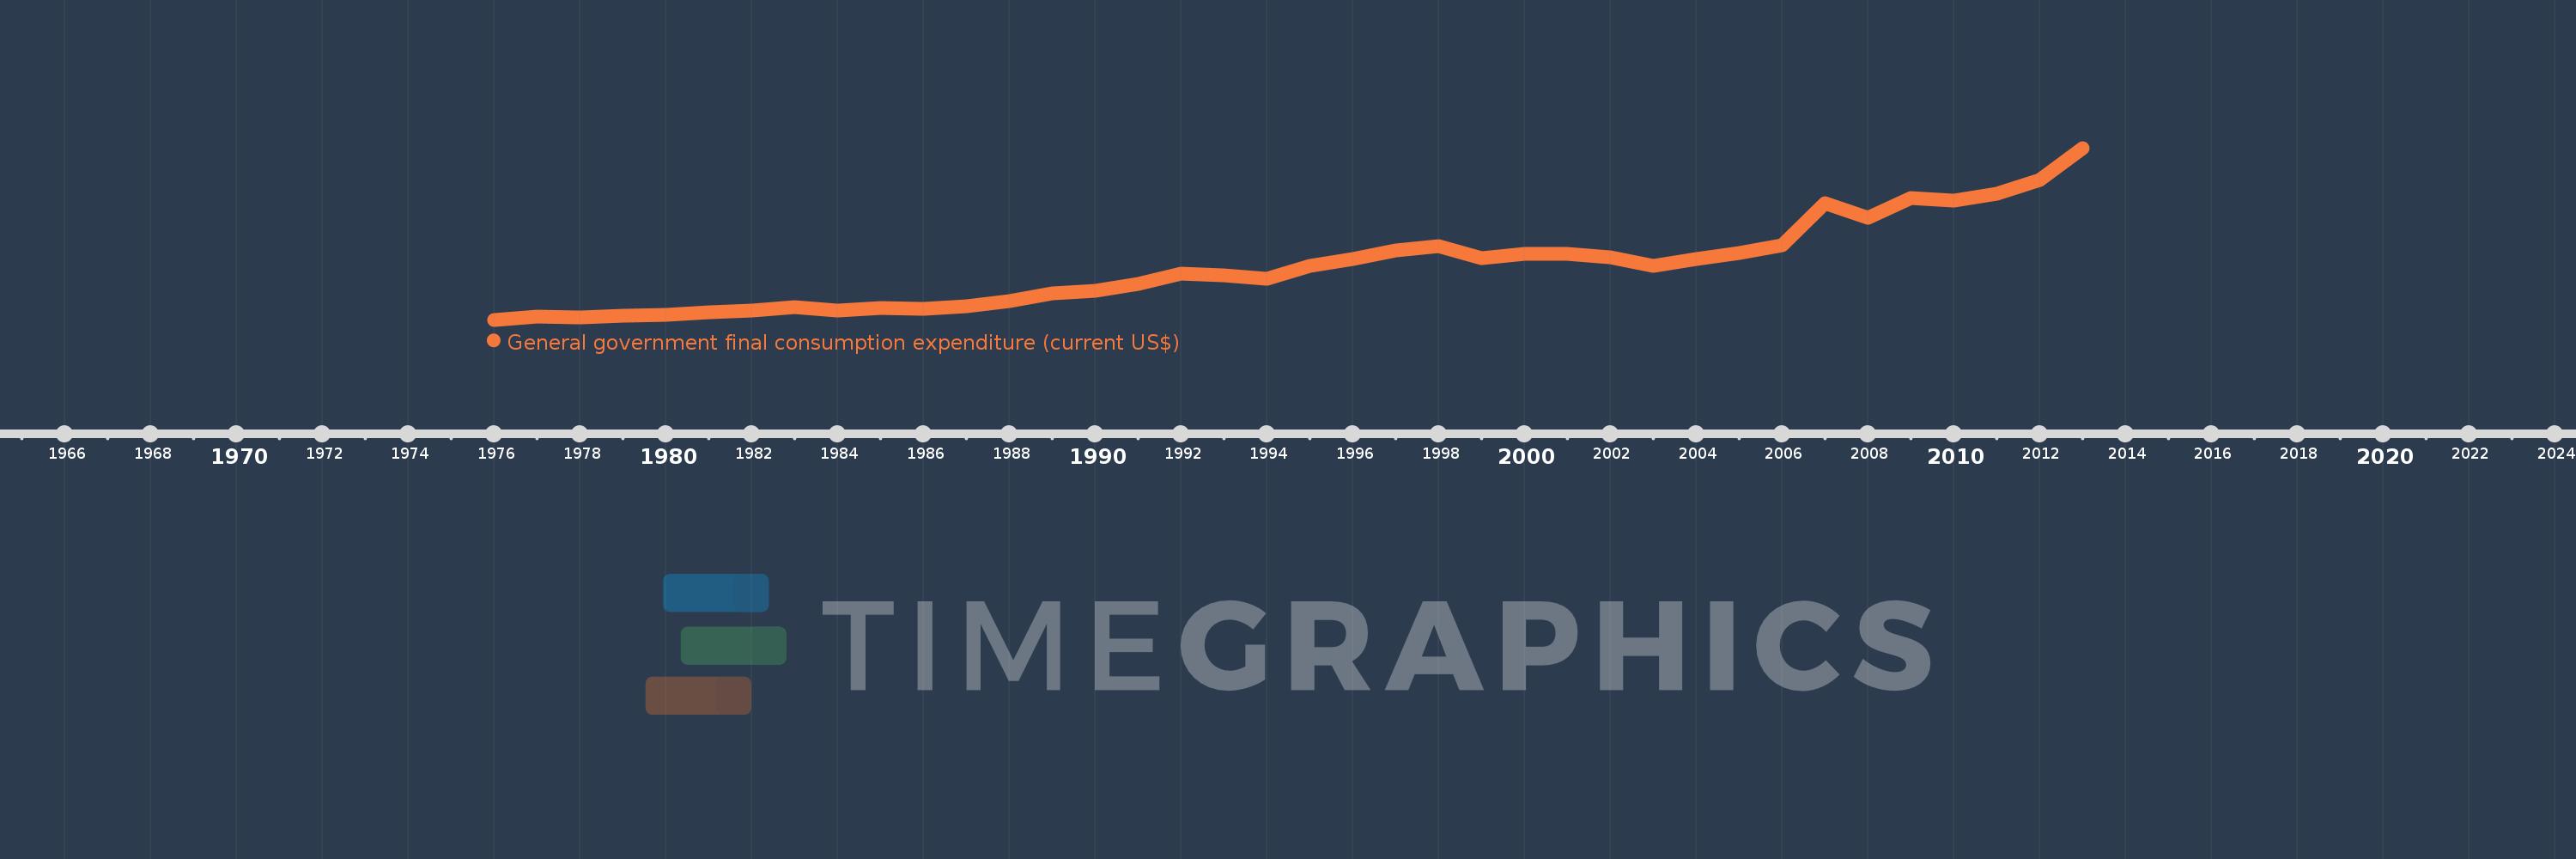
General government final consumption expenditure (current US$)
2013,2012,2011,2010,2009,2008,2007,2006,2005,2004,2003,2002,2001,2000,1999,1998,1997,1996,1995,1994,1993,1992,1991,1990,1989,1988,1987,1986,1985,1984,1983,1982,1981,1980,1979,1978,1977,1976
This statistics in other country:
AfghanistanAlbaniaAlgeriaAngolaAntigua and BarbudaArab WorldArgentinaArmeniaArubaAustraliaAustriaAzerbaijanBahamas, TheBahrainBangladeshBarbadosBelarusBelgiumBelizeBeninBermudaBhutanBoliviaBosnia and HerzegovinaBotswanaBrazilBrunei DarussalamBulgariaBurkina FasoBurundiCabo VerdeCambodiaCameroonCanadaCaribbean small statesCentral African RepublicCentral Europe and the BalticsChadChileChinaColombiaComorosCongo, Dem. Rep.Congo, Rep.Costa RicaCote d'IvoireCroatiaCubaCyprusCzech RepublicDenmarkDjiboutiDominicaDominican RepublicEarly-demographic dividendEast Asia & PacificEast Asia & Pacific (excluding high income)East Asia & Pacific (IDA & IBRD countries)EcuadorEgypt, Arab Rep.El SalvadorEquatorial GuineaEritreaEstoniaEthiopiaEuro areaEurope & Central AsiaEurope & Central Asia (excluding high income)Europe & Central Asia (IDA & IBRD countries)European UnionFaroe IslandsFijiFinlandFragile and conflict affected situationsFranceFrench PolynesiaGabonGambia, TheGeorgiaGermanyGhanaGreeceGrenadaGuatemalaGuineaGuinea-BissauGuyanaHaitiHeavily indebted poor countries (HIPC)High incomeHondurasHong Kong SAR, ChinaHungaryIBRD onlyIcelandIDA & IBRD totalIDA blendIDA onlyIDA totalIndiaIndonesiaIran, Islamic Rep.IraqIrelandIsraelItalyJamaicaJapanJordanKazakhstanKenyaKiribatiKorea, Rep.KosovoKuwaitKyrgyz RepublicLao PDRLate-demographic dividendLatin America & Caribbean Latin America & Caribbean (excluding high income)Latin America & the Caribbean (IDA & IBRD countries)LatviaLeast developed countries: UN classificationLebanonLesothoLiberiaLibyaLithuaniaLow & middle incomeLow incomeLower middle incomeLuxembourgMacao SAR, ChinaMacedonia, FYRMadagascarMalawiMalaysiaMaldivesMaliMaltaMauritaniaMauritiusMexicoMicronesia, Fed. Sts.Middle East & North AfricaMiddle East & North Africa (excluding high income)Middle East & North Africa (IDA & IBRD countries)Middle incomeMoldovaMongoliaMontenegroMoroccoMozambiqueNamibiaNepalNetherlandsNew CaledoniaNew ZealandNicaraguaNigerNigeriaNorth AmericaNorwayOECD membersOmanOther small statesPakistanPanamaPapua New GuineaParaguayPeruPhilippinesPolandPortugalPost-demographic dividendPre-demographic dividendPuerto RicoQatarRomaniaRussian FederationRwandaSaudi ArabiaSenegalSerbiaSeychellesSierra LeoneSingaporeSlovak RepublicSloveniaSmall statesSolomon IslandsSomaliaSouth AfricaSouth AsiaSouth Asia (IDA & IBRD)South SudanSpainSri LankaSt. Kitts and NevisSt. LuciaSt. Vincent and the GrenadinesSub-Saharan Africa Sub-Saharan Africa (excluding high income)Sub-Saharan Africa (IDA & IBRD countries)SudanSurinameSwazilandSwedenSwitzerlandSyrian Arab RepublicTajikistanTanzaniaThailandTimor-LesteTogoTongaTrinidad and TobagoTunisiaTurkeyTurkmenistanUgandaUkraineUnited Arab EmiratesUnited KingdomUnited StatesUpper middle incomeUruguayUzbekistanVanuatuVenezuela, RBVietnamWest Bank and GazaWorldYemen, Rep.ZambiaZimbabwe Timeline:
This timeline shows a graph from 1976 to 2013 of Tonga. No data until 1975. Number of actual observations by date: 38.
Source name:
World Development Indicators
Source organization:
World Bank national accounts data, and OECD National Accounts data files.
Categories, topics:
Economy & Growth
Last updated:
apr 23, 2017
Indicators value changes by year
Minimum:
4.224 mln
jan 1, 1976
Maximum:
89.111 mln
jan 1, 2013
At the date of observation
Value
Absolute change
Change from previous value
jan 1, 1976
4.224 mln
+4.224 mln
0.0%
jan 1, 1977
5.757 mln
+1.534 mln
36.31%
jan 1, 1978
5.221 mln
-535.967K
-9.31%
jan 1, 1979
6.116 mln
+894.952K
17.14%
jan 1, 1980
6.665 mln
+548.256K
8.96%
jan 1, 1981
7.898 mln
+1.233 mln
18.51%
jan 1, 1982
8.729 mln
+831.055K
10.52%
jan 1, 1983
10.491 mln
+1.762 mln
20.18%
jan 1, 1984
8.704 mln
-1.787 mln
-17.04%
jan 1, 1985
10.167 mln
+1.463 mln
16.81%
jan 1, 1986
9.588 mln
-578.78K
-5.69%
jan 1, 1987
10.766 mln
+1.178 mln
12.29%
jan 1, 1988
13.603 mln
+2.837 mln
26.35%
jan 1, 1989
17.375 mln
+3.772 mln
27.73%
jan 1, 1990
18.516 mln
+1.141 mln
6.57%
jan 1, 1991
21.726 mln
+3.209 mln
17.33%
jan 1, 1992
27.014 mln
+5.288 mln
24.34%
jan 1, 1993
25.965 mln
-1.049 mln
-3.88%
jan 1, 1994
24.478 mln
-1.487 mln
-5.73%
jan 1, 1995
30.984 mln
+6.506 mln
26.58%
jan 1, 1996
34.125 mln
+3.141 mln
10.14%
jan 1, 1997
38.614 mln
+4.49 mln
13.16%
jan 1, 1998
40.469 mln
+1.855 mln
4.8%
jan 1, 1999
34.847 mln
-5.623 mln
-13.89%
jan 1, 2000
36.971 mln
+2.124 mln
6.1%
jan 1, 2001
36.833 mln
-137.981K
-0.37%
jan 1, 2002
34.936 mln
-1.897 mln
-5.15%
jan 1, 2003
30.887 mln
-4.049 mln
-11.59%
jan 1, 2004
34.075 mln
+3.188 mln
10.32%
jan 1, 2005
37.091 mln
+3.016 mln
8.85%
jan 1, 2006
40.864 mln
+3.773 mln
10.17%
jan 1, 2007
61.855 mln
+20.991 mln
51.37%
jan 1, 2008
54.431 mln
-7.423 mln
-12.0%
jan 1, 2009
64.212 mln
+9.781 mln
17.97%
jan 1, 2010
63.086 mln
-1.126 mln
-1.75%
jan 1, 2011
66.676 mln
+3.589 mln
5.69%
jan 1, 2012
73.303 mln
+6.627 mln
9.94%
jan 1, 2013
89.111 mln
+15.808 mln
21.57%
Ranking of countries by current statistics by years


Comments: