29
/
en
AIzaSyAYiBZKx7MnpbEhh9jyipgxe19OcubqV5w
April 1, 2024
116902
Cyprus
CYP
true
2
1
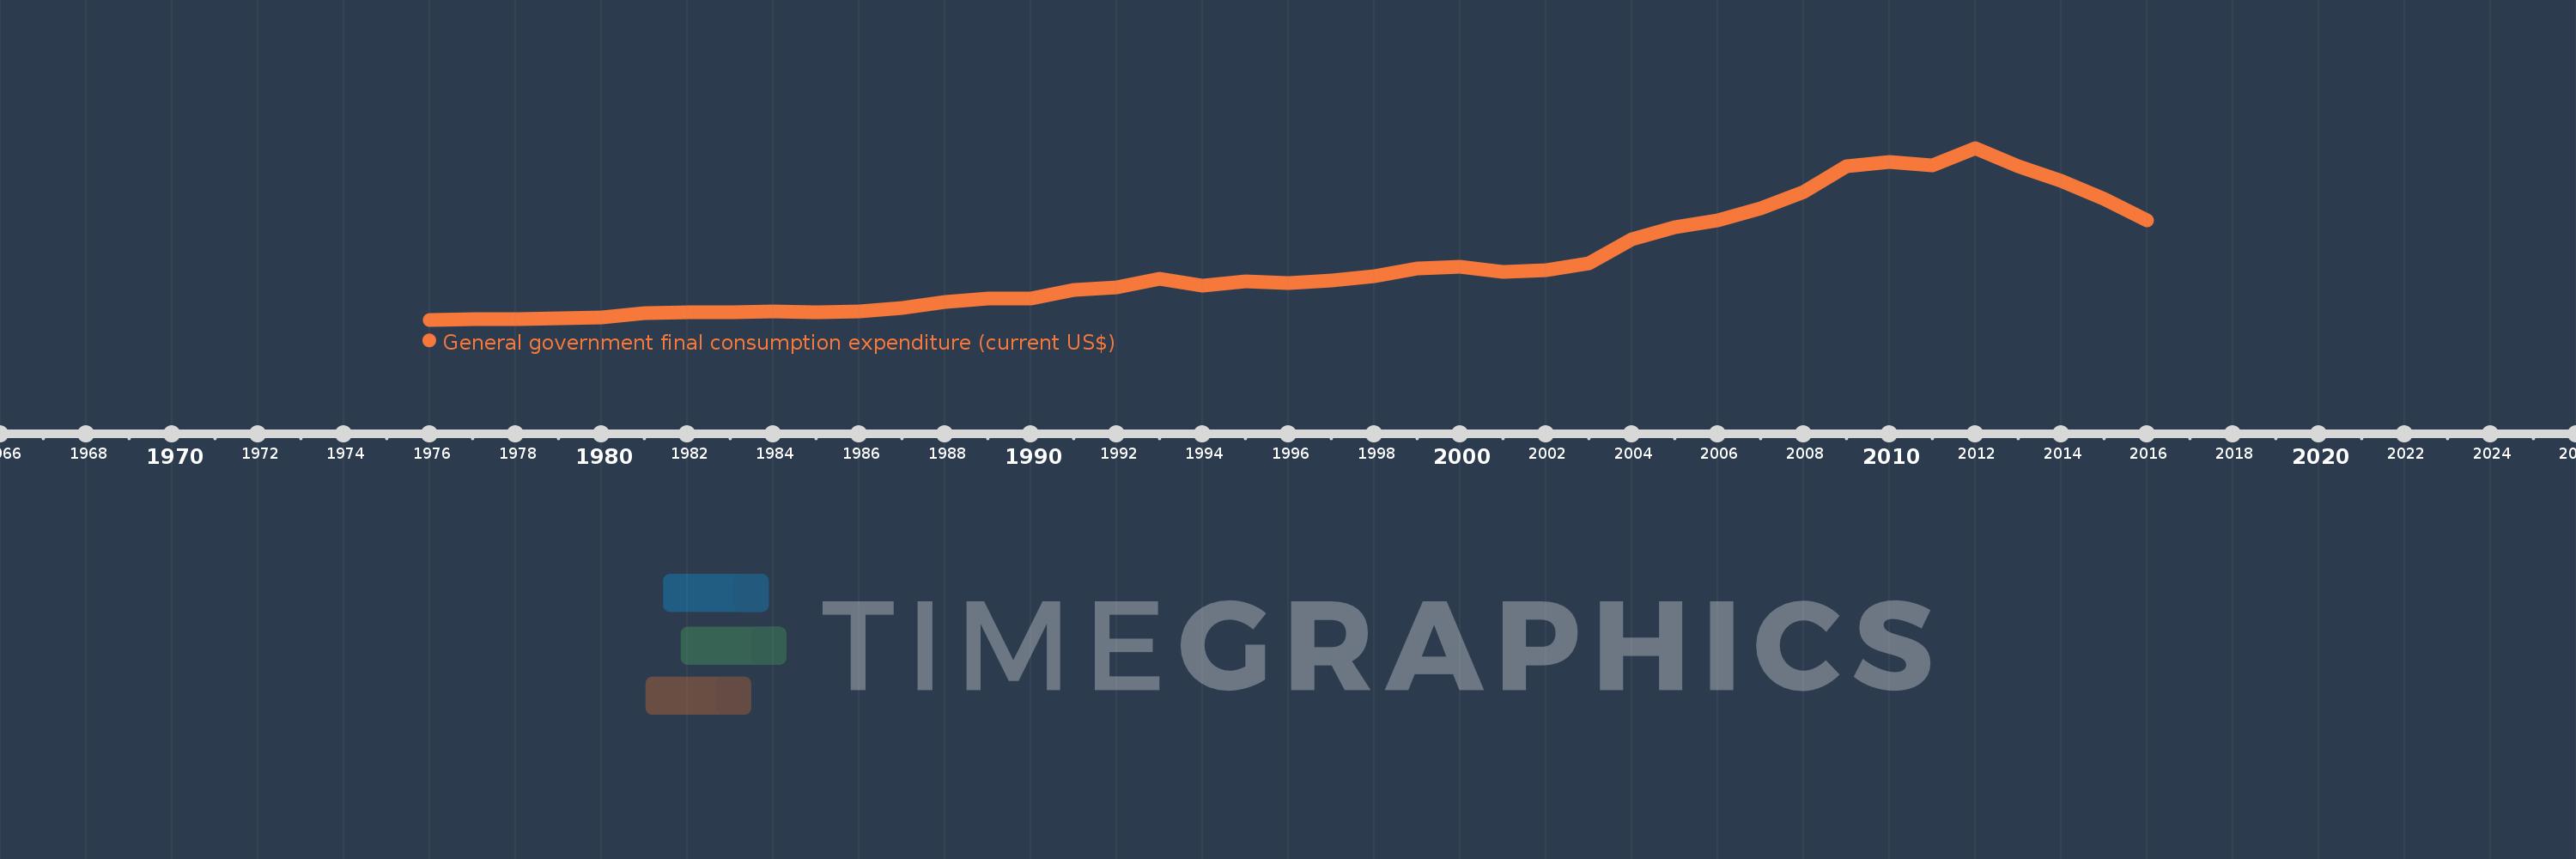
General government final consumption expenditure (current US$)
2016,2015,2014,2013,2012,2011,2010,2009,2008,2007,2006,2005,2004,2003,2002,2001,2000,1999,1998,1997,1996,1995,1994,1993,1992,1991,1990,1989,1988,1987,1986,1985,1984,1983,1982,1981,1980,1979,1978,1977,1976
This statistics in other country:
AfghanistanAlbaniaAlgeriaAngolaAntigua and BarbudaArab WorldArgentinaArmeniaArubaAustraliaAustriaAzerbaijanBahamas, TheBahrainBangladeshBarbadosBelarusBelgiumBelizeBeninBermudaBhutanBoliviaBosnia and HerzegovinaBotswanaBrazilBrunei DarussalamBulgariaBurkina FasoBurundiCabo VerdeCambodiaCameroonCanadaCaribbean small statesCentral African RepublicCentral Europe and the BalticsChadChileChinaColombiaComorosCongo, Dem. Rep.Congo, Rep.Costa RicaCote d'IvoireCroatiaCubaCyprusCzech RepublicDenmarkDjiboutiDominicaDominican RepublicEarly-demographic dividendEast Asia & PacificEast Asia & Pacific (excluding high income)East Asia & Pacific (IDA & IBRD countries)EcuadorEgypt, Arab Rep.El SalvadorEquatorial GuineaEritreaEstoniaEthiopiaEuro areaEurope & Central AsiaEurope & Central Asia (excluding high income)Europe & Central Asia (IDA & IBRD countries)European UnionFaroe IslandsFijiFinlandFragile and conflict affected situationsFranceFrench PolynesiaGabonGambia, TheGeorgiaGermanyGhanaGreeceGrenadaGuatemalaGuineaGuinea-BissauGuyanaHaitiHeavily indebted poor countries (HIPC)High incomeHondurasHong Kong SAR, ChinaHungaryIBRD onlyIcelandIDA & IBRD totalIDA blendIDA onlyIDA totalIndiaIndonesiaIran, Islamic Rep.IraqIrelandIsraelItalyJamaicaJapanJordanKazakhstanKenyaKiribatiKorea, Rep.KosovoKuwaitKyrgyz RepublicLao PDRLate-demographic dividendLatin America & Caribbean Latin America & Caribbean (excluding high income)Latin America & the Caribbean (IDA & IBRD countries)LatviaLeast developed countries: UN classificationLebanonLesothoLiberiaLibyaLithuaniaLow & middle incomeLow incomeLower middle incomeLuxembourgMacao SAR, ChinaMacedonia, FYRMadagascarMalawiMalaysiaMaldivesMaliMaltaMauritaniaMauritiusMexicoMicronesia, Fed. Sts.Middle East & North AfricaMiddle East & North Africa (excluding high income)Middle East & North Africa (IDA & IBRD countries)Middle incomeMoldovaMongoliaMontenegroMoroccoMozambiqueNamibiaNepalNetherlandsNew CaledoniaNew ZealandNicaraguaNigerNigeriaNorth AmericaNorwayOECD membersOmanOther small statesPakistanPanamaPapua New GuineaParaguayPeruPhilippinesPolandPortugalPost-demographic dividendPre-demographic dividendPuerto RicoQatarRomaniaRussian FederationRwandaSaudi ArabiaSenegalSerbiaSeychellesSierra LeoneSingaporeSlovak RepublicSloveniaSmall statesSolomon IslandsSomaliaSouth AfricaSouth AsiaSouth Asia (IDA & IBRD)South SudanSpainSri LankaSt. Kitts and NevisSt. LuciaSt. Vincent and the GrenadinesSub-Saharan Africa Sub-Saharan Africa (excluding high income)Sub-Saharan Africa (IDA & IBRD countries)SudanSurinameSwazilandSwedenSwitzerlandSyrian Arab RepublicTajikistanTanzaniaThailandTimor-LesteTogoTongaTrinidad and TobagoTunisiaTurkeyTurkmenistanUgandaUkraineUnited Arab EmiratesUnited KingdomUnited StatesUpper middle incomeUruguayUzbekistanVanuatuVenezuela, RBVietnamWest Bank and GazaWorldYemen, Rep.ZambiaZimbabwe Timeline:
This timeline shows a graph from 1976 to 2016 of Cyprus. No data until 1975. Number of actual observations by date: 41.
Source name:
World Development Indicators
Source organization:
World Bank national accounts data, and OECD National Accounts data files.
Categories, topics:
Economy & Growth
Last updated:
apr 23, 2017
Indicators value changes by year
Minimum:
85.592 mln
jan 1, 1976
Maximum:
5.244 bln
jan 1, 2012
At the date of observation
Value
Absolute change
Change from previous value
jan 1, 1976
85.592 mln
+85.592 mln
0.0%
jan 1, 1977
94.031 mln
+8.439 mln
9.86%
jan 1, 1978
102.825 mln
+8.794 mln
9.35%
jan 1, 1979
126.189 mln
+23.364 mln
22.72%
jan 1, 1980
164.721 mln
+38.532 mln
30.53%
jan 1, 1981
294.401 mln
+129.679 mln
78.73%
jan 1, 1982
305.022 mln
+10.621 mln
3.61%
jan 1, 1983
320.442 mln
+15.419 mln
5.06%
jan 1, 1984
326.706 mln
+6.264 mln
1.95%
jan 1, 1985
321.449 mln
-5.257 mln
-1.61%
jan 1, 1986
341.884 mln
+20.436 mln
6.36%
jan 1, 1987
436.128 mln
+94.244 mln
27.57%
jan 1, 1988
615.388 mln
+179.26 mln
41.1%
jan 1, 1989
712.811 mln
+97.423 mln
15.83%
jan 1, 1990
729.34 mln
+16.53 mln
2.32%
jan 1, 1991
969.374 mln
+240.034 mln
32.91%
jan 1, 1992
1.065 bln
+95.697 mln
9.87%
jan 1, 1993
1.316 bln
+250.797 mln
23.55%
jan 1, 1994
1.112 bln
-203.969 mln
-15.5%
jan 1, 1995
1.237 bln
+125.006 mln
11.24%
jan 1, 1996
1.182 bln
-55.405 mln
-4.48%
jan 1, 1997
1.264 bln
+82.113 mln
6.95%
jan 1, 1998
1.384 bln
+120.309 mln
9.52%
jan 1, 1999
1.633 bln
+249.335 mln
18.02%
jan 1, 2000
1.68 bln
+46.677 mln
2.86%
jan 1, 2001
1.513 bln
-166.74 mln
-9.93%
jan 1, 2002
1.565 bln
+52.288 mln
3.46%
jan 1, 2003
1.769 bln
+203.556 mln
13.0%
jan 1, 2004
2.511 bln
+741.72 mln
41.93%
jan 1, 2005
2.861 bln
+350.741 mln
13.97%
jan 1, 2006
3.074 bln
+212.62 mln
7.43%
jan 1, 2007
3.427 bln
+353.304 mln
11.49%
jan 1, 2008
3.932 bln
+504.276 mln
14.71%
jan 1, 2009
4.684 bln
+751.909 mln
19.12%
jan 1, 2010
4.811 bln
+127.588 mln
2.72%
jan 1, 2011
4.728 bln
-83.648 mln
-1.74%
jan 1, 2012
5.244 bln
+515.987 mln
10.91%
jan 1, 2013
4.69 bln
-553.828 mln
-10.56%
jan 1, 2014
4.243 bln
-446.479 mln
-9.52%
jan 1, 2015
3.725 bln
-518.537 mln
-12.22%
jan 1, 2016
3.074 bln
-650.277 mln
-17.46%
Ranking of countries by current statistics by years


Comments: