29
/
en
AIzaSyAYiBZKx7MnpbEhh9jyipgxe19OcubqV5w
April 1, 2024
245602
South Africa
ZAF
true
2
1
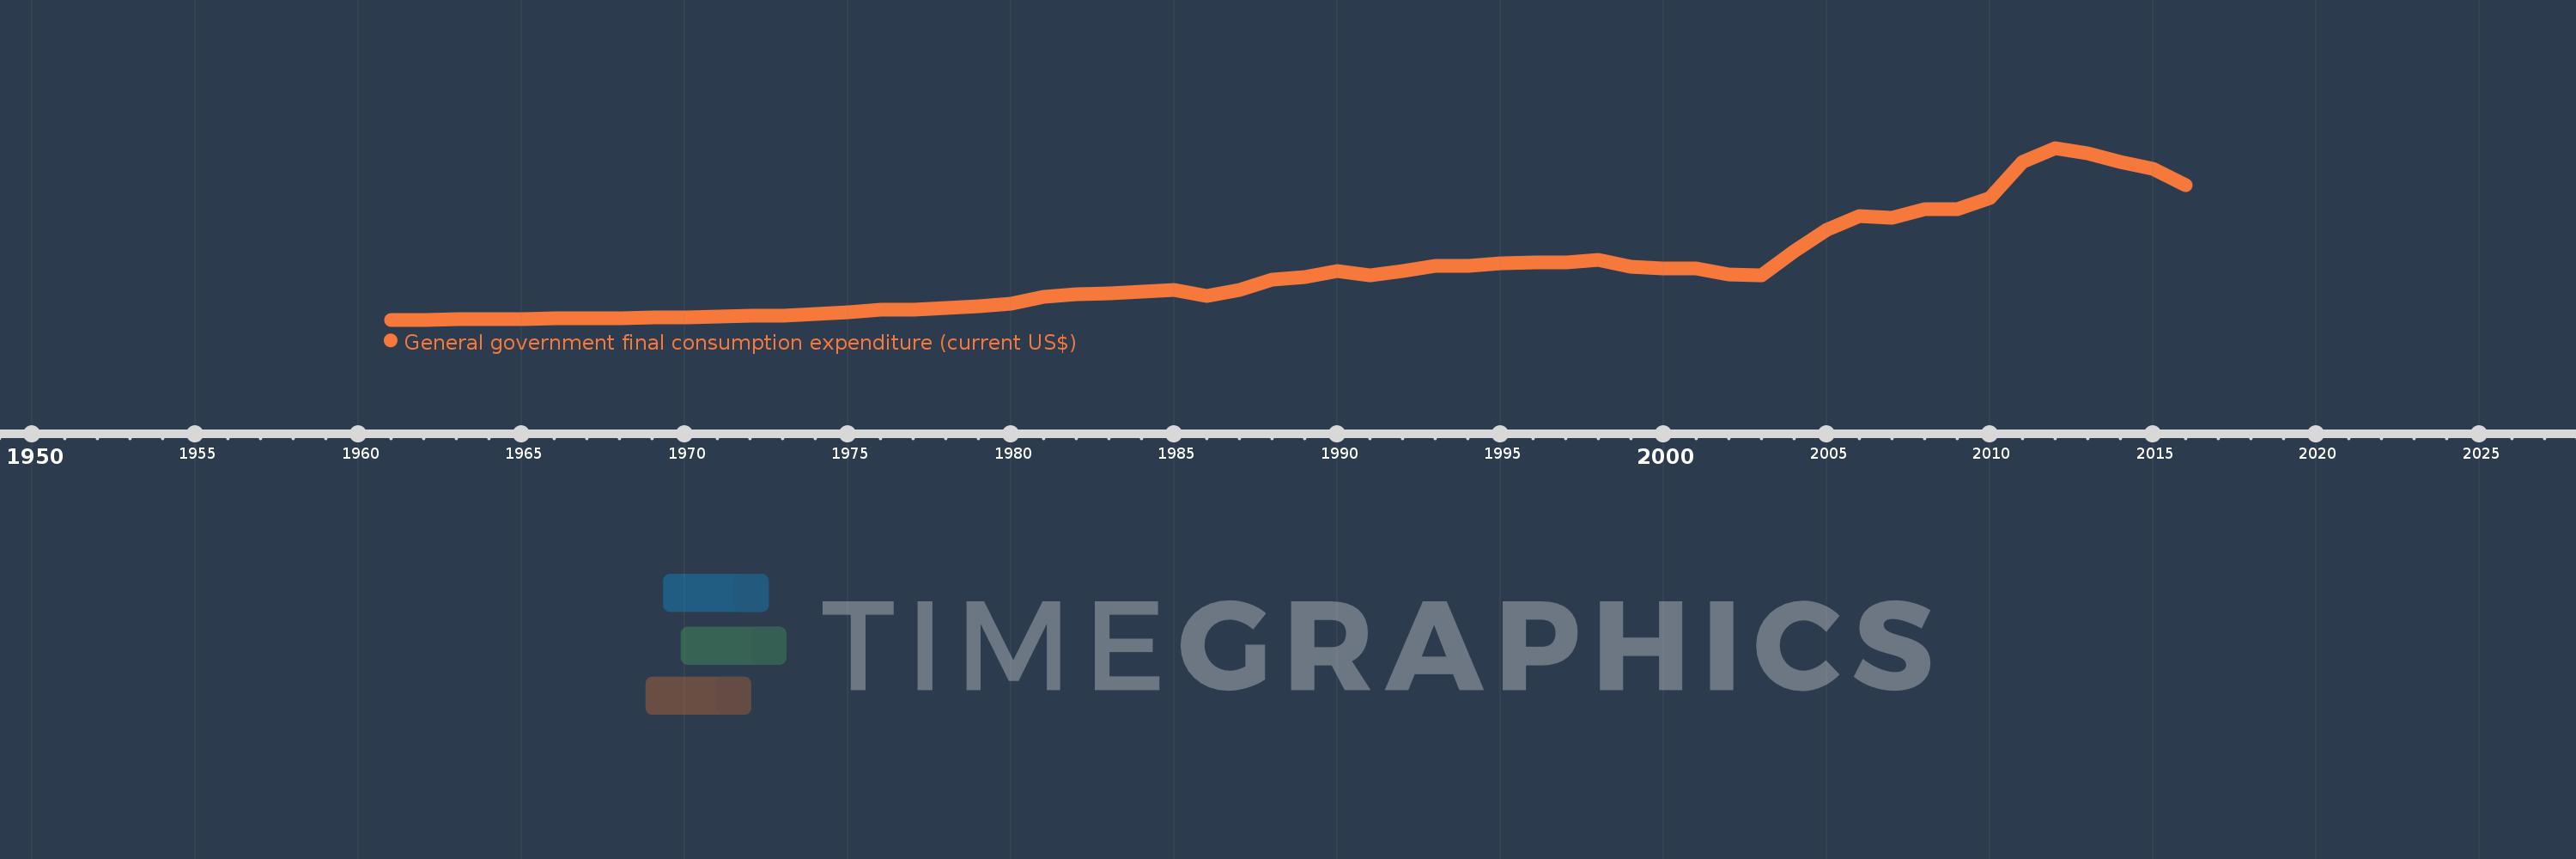
General government final consumption expenditure (current US$)
2016,2015,2014,2013,2012,2011,2010,2009,2008,2007,2006,2005,2004,2003,2002,2001,2000,1999,1998,1997,1996,1995,1994,1993,1992,1991,1990,1989,1988,1987,1986,1985,1984,1983,1982,1981,1980,1979,1978,1977,1976,1975,1974,1973,1972,1971,1970,1969,1968,1967,1966,1965,1964,1963,1962,1961
This statistics in other country:
AfghanistanAlbaniaAlgeriaAngolaAntigua and BarbudaArab WorldArgentinaArmeniaArubaAustraliaAustriaAzerbaijanBahamas, TheBahrainBangladeshBarbadosBelarusBelgiumBelizeBeninBermudaBhutanBoliviaBosnia and HerzegovinaBotswanaBrazilBrunei DarussalamBulgariaBurkina FasoBurundiCabo VerdeCambodiaCameroonCanadaCaribbean small statesCentral African RepublicCentral Europe and the BalticsChadChileChinaColombiaComorosCongo, Dem. Rep.Congo, Rep.Costa RicaCote d'IvoireCroatiaCubaCyprusCzech RepublicDenmarkDjiboutiDominicaDominican RepublicEarly-demographic dividendEast Asia & PacificEast Asia & Pacific (excluding high income)East Asia & Pacific (IDA & IBRD countries)EcuadorEgypt, Arab Rep.El SalvadorEquatorial GuineaEritreaEstoniaEthiopiaEuro areaEurope & Central AsiaEurope & Central Asia (excluding high income)Europe & Central Asia (IDA & IBRD countries)European UnionFaroe IslandsFijiFinlandFragile and conflict affected situationsFranceFrench PolynesiaGabonGambia, TheGeorgiaGermanyGhanaGreeceGrenadaGuatemalaGuineaGuinea-BissauGuyanaHaitiHeavily indebted poor countries (HIPC)High incomeHondurasHong Kong SAR, ChinaHungaryIBRD onlyIcelandIDA & IBRD totalIDA blendIDA onlyIDA totalIndiaIndonesiaIran, Islamic Rep.IraqIrelandIsraelItalyJamaicaJapanJordanKazakhstanKenyaKiribatiKorea, Rep.KosovoKuwaitKyrgyz RepublicLao PDRLate-demographic dividendLatin America & Caribbean Latin America & Caribbean (excluding high income)Latin America & the Caribbean (IDA & IBRD countries)LatviaLeast developed countries: UN classificationLebanonLesothoLiberiaLibyaLithuaniaLow & middle incomeLow incomeLower middle incomeLuxembourgMacao SAR, ChinaMacedonia, FYRMadagascarMalawiMalaysiaMaldivesMaliMaltaMauritaniaMauritiusMexicoMicronesia, Fed. Sts.Middle East & North AfricaMiddle East & North Africa (excluding high income)Middle East & North Africa (IDA & IBRD countries)Middle incomeMoldovaMongoliaMontenegroMoroccoMozambiqueNamibiaNepalNetherlandsNew CaledoniaNew ZealandNicaraguaNigerNigeriaNorth AmericaNorwayOECD membersOmanOther small statesPakistanPanamaPapua New GuineaParaguayPeruPhilippinesPolandPortugalPost-demographic dividendPre-demographic dividendPuerto RicoQatarRomaniaRussian FederationRwandaSaudi ArabiaSenegalSerbiaSeychellesSierra LeoneSingaporeSlovak RepublicSloveniaSmall statesSolomon IslandsSomaliaSouth AfricaSouth AsiaSouth Asia (IDA & IBRD)South SudanSpainSri LankaSt. Kitts and NevisSt. LuciaSt. Vincent and the GrenadinesSub-Saharan Africa Sub-Saharan Africa (excluding high income)Sub-Saharan Africa (IDA & IBRD countries)SudanSurinameSwazilandSwedenSwitzerlandSyrian Arab RepublicTajikistanTanzaniaThailandTimor-LesteTogoTongaTrinidad and TobagoTunisiaTurkeyTurkmenistanUgandaUkraineUnited Arab EmiratesUnited KingdomUnited StatesUpper middle incomeUruguayUzbekistanVanuatuVenezuela, RBVietnamWest Bank and GazaWorldYemen, Rep.ZambiaZimbabwe Timeline:
This timeline shows a graph from 1961 to 2016 of South Africa. No data until 1960. Number of actual observations by date: 56.
Source name:
World Development Indicators
Source organization:
World Bank national accounts data, and OECD National Accounts data files.
Categories, topics:
Economy & Growth
Last updated:
apr 23, 2017
Indicators value changes by year
Minimum:
714.153 mln
jan 1, 1961
Maximum:
82.71 bln
jan 1, 2012
At the date of observation
Value
Absolute change
Change from previous value
jan 1, 1961
714.153 mln
+714.153 mln
0.0%
jan 1, 1962
769.665 mln
+55.512 mln
7.77%
jan 1, 1963
910.695 mln
+141.031 mln
18.32%
jan 1, 1964
1.013 bln
+102.022 mln
11.2%
jan 1, 1965
1.148 bln
+135.029 mln
13.33%
jan 1, 1966
1.277 bln
+129.029 mln
11.24%
jan 1, 1967
1.435 bln
+158.197 mln
12.39%
jan 1, 1968
1.536 bln
+100.798 mln
7.02%
jan 1, 1969
1.687 bln
+151.197 mln
9.85%
jan 1, 1970
1.936 bln
+249.195 mln
14.77%
jan 1, 1971
2.29 bln
+354.193 mln
18.29%
jan 1, 1972
2.75 bln
+459.926 mln
20.08%
jan 1, 1973
2.729 bln
-20.997 mln
-0.76%
jan 1, 1974
3.468 bln
+739.017 mln
27.08%
jan 1, 1975
4.483 bln
+1.014 bln
29.25%
jan 1, 1976
5.459 bln
+976.386 mln
21.78%
jan 1, 1977
5.628 bln
+168.781 mln
3.09%
jan 1, 1978
6.365 bln
+737.121 mln
13.1%
jan 1, 1979
7.0 bln
+634.775 mln
9.97%
jan 1, 1980
8.403 bln
+1.403 bln
20.04%
jan 1, 1981
11.511 bln
+3.109 bln
37.0%
jan 1, 1982
12.934 bln
+1.423 bln
12.36%
jan 1, 1983
13.17 bln
+235.71 mln
1.82%
jan 1, 1984
14.134 bln
+964.524 mln
7.32%
jan 1, 1985
15.006 bln
+871.783 mln
6.17%
jan 1, 1986
12.213 bln
-2.793 bln
-18.61%
jan 1, 1987
14.957 bln
+2.743 bln
22.46%
jan 1, 1988
19.968 bln
+5.012 bln
33.51%
jan 1, 1989
21.244 bln
+1.276 bln
6.39%
jan 1, 1990
23.954 bln
+2.709 bln
12.75%
jan 1, 1991
22.027 bln
-1.926 bln
-8.04%
jan 1, 1992
23.781 bln
+1.754 bln
7.96%
jan 1, 1993
26.387 bln
+2.606 bln
10.96%
jan 1, 1994
26.385 bln
-2.224 mln
-0.01%
jan 1, 1995
27.647 bln
+1.262 bln
4.78%
jan 1, 1996
28.143 bln
+496.693 mln
1.8%
jan 1, 1997
28.247 bln
+103.504 mln
0.37%
jan 1, 1998
29.384 bln
+1.137 bln
4.02%
jan 1, 1999
26.014 bln
-3.369 bln
-11.47%
jan 1, 2000
25.326 bln
-688.522 mln
-2.65%
jan 1, 2001
25.035 bln
-291.077 mln
-1.15%
jan 1, 2002
22.367 bln
-2.667 bln
-10.65%
jan 1, 2003
21.717 bln
-650.7 mln
-2.91%
jan 1, 2004
33.4 bln
+11.684 bln
53.8%
jan 1, 2005
43.793 bln
+10.393 bln
31.12%
jan 1, 2006
50.209 bln
+6.416 bln
14.65%
jan 1, 2007
49.312 bln
-897.488 mln
-1.79%
jan 1, 2008
53.338 bln
+4.026 bln
8.16%
jan 1, 2009
53.505 bln
+167.379 mln
0.31%
jan 1, 2010
58.786 bln
+5.281 bln
9.87%
jan 1, 2011
75.932 bln
+17.146 bln
29.17%
jan 1, 2012
82.71 bln
+6.778 bln
8.93%
jan 1, 2013
80.296 bln
-2.414 bln
-2.92%
jan 1, 2014
75.864 bln
-4.432 bln
-5.52%
jan 1, 2015
72.558 bln
-3.306 bln
-4.36%
jan 1, 2016
64.98 bln
-7.579 bln
-10.44%
Ranking of countries by current statistics by years


Comments: