29
/
en
AIzaSyAYiBZKx7MnpbEhh9jyipgxe19OcubqV5w
April 1, 2024
80551
Belarus
BLR
true
2
1
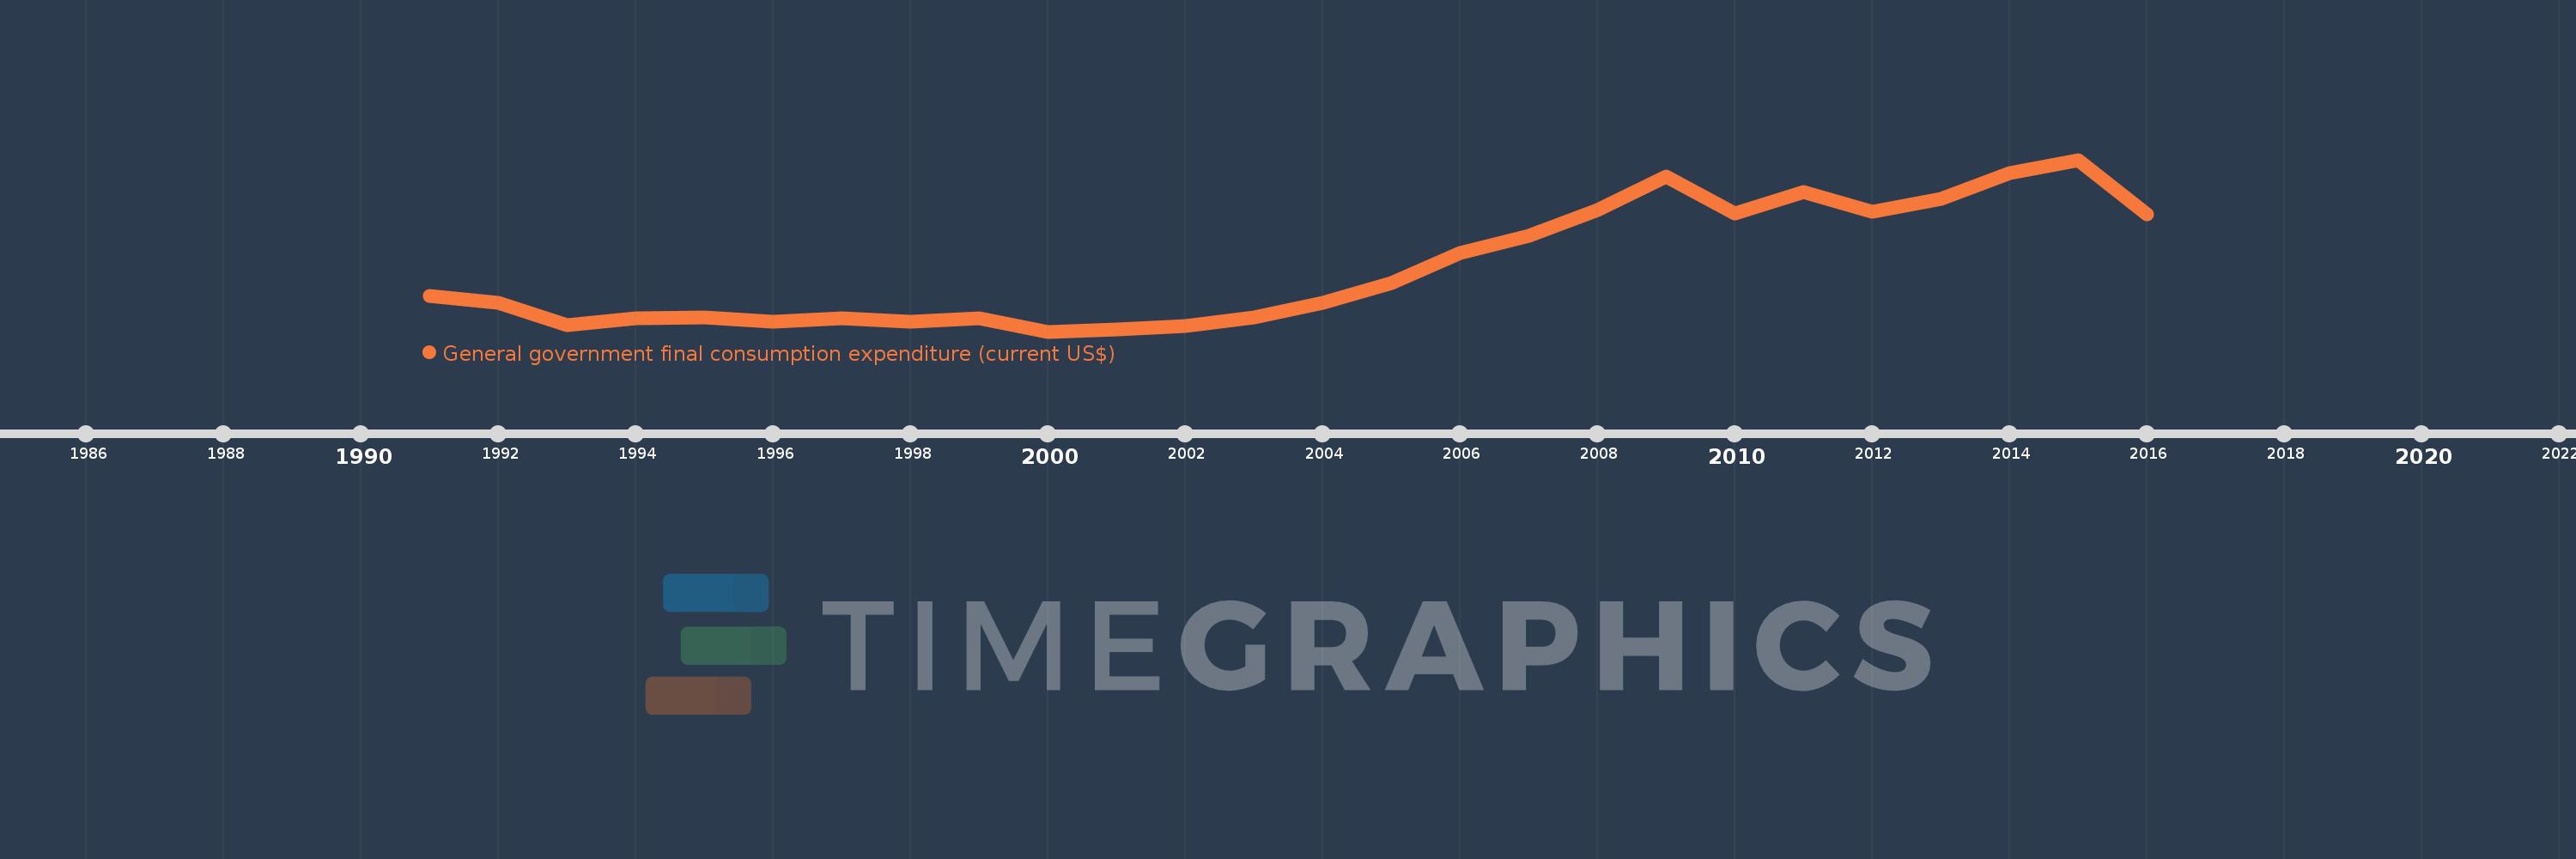
General government final consumption expenditure (current US$)
2016,2015,2014,2013,2012,2011,2010,2009,2008,2007,2006,2005,2004,2003,2002,2001,2000,1999,1998,1997,1996,1995,1994,1993,1992,1991
This statistics in other country:
AfghanistanAlbaniaAlgeriaAngolaAntigua and BarbudaArab WorldArgentinaArmeniaArubaAustraliaAustriaAzerbaijanBahamas, TheBahrainBangladeshBarbadosBelarusBelgiumBelizeBeninBermudaBhutanBoliviaBosnia and HerzegovinaBotswanaBrazilBrunei DarussalamBulgariaBurkina FasoBurundiCabo VerdeCambodiaCameroonCanadaCaribbean small statesCentral African RepublicCentral Europe and the BalticsChadChileChinaColombiaComorosCongo, Dem. Rep.Congo, Rep.Costa RicaCote d'IvoireCroatiaCubaCyprusCzech RepublicDenmarkDjiboutiDominicaDominican RepublicEarly-demographic dividendEast Asia & PacificEast Asia & Pacific (excluding high income)East Asia & Pacific (IDA & IBRD countries)EcuadorEgypt, Arab Rep.El SalvadorEquatorial GuineaEritreaEstoniaEthiopiaEuro areaEurope & Central AsiaEurope & Central Asia (excluding high income)Europe & Central Asia (IDA & IBRD countries)European UnionFaroe IslandsFijiFinlandFragile and conflict affected situationsFranceFrench PolynesiaGabonGambia, TheGeorgiaGermanyGhanaGreeceGrenadaGuatemalaGuineaGuinea-BissauGuyanaHaitiHeavily indebted poor countries (HIPC)High incomeHondurasHong Kong SAR, ChinaHungaryIBRD onlyIcelandIDA & IBRD totalIDA blendIDA onlyIDA totalIndiaIndonesiaIran, Islamic Rep.IraqIrelandIsraelItalyJamaicaJapanJordanKazakhstanKenyaKiribatiKorea, Rep.KosovoKuwaitKyrgyz RepublicLao PDRLate-demographic dividendLatin America & Caribbean Latin America & Caribbean (excluding high income)Latin America & the Caribbean (IDA & IBRD countries)LatviaLeast developed countries: UN classificationLebanonLesothoLiberiaLibyaLithuaniaLow & middle incomeLow incomeLower middle incomeLuxembourgMacao SAR, ChinaMacedonia, FYRMadagascarMalawiMalaysiaMaldivesMaliMaltaMauritaniaMauritiusMexicoMicronesia, Fed. Sts.Middle East & North AfricaMiddle East & North Africa (excluding high income)Middle East & North Africa (IDA & IBRD countries)Middle incomeMoldovaMongoliaMontenegroMoroccoMozambiqueNamibiaNepalNetherlandsNew CaledoniaNew ZealandNicaraguaNigerNigeriaNorth AmericaNorwayOECD membersOmanOther small statesPakistanPanamaPapua New GuineaParaguayPeruPhilippinesPolandPortugalPost-demographic dividendPre-demographic dividendPuerto RicoQatarRomaniaRussian FederationRwandaSaudi ArabiaSenegalSerbiaSeychellesSierra LeoneSingaporeSlovak RepublicSloveniaSmall statesSolomon IslandsSomaliaSouth AfricaSouth AsiaSouth Asia (IDA & IBRD)South SudanSpainSri LankaSt. Kitts and NevisSt. LuciaSt. Vincent and the GrenadinesSub-Saharan Africa Sub-Saharan Africa (excluding high income)Sub-Saharan Africa (IDA & IBRD countries)SudanSurinameSwazilandSwedenSwitzerlandSyrian Arab RepublicTajikistanTanzaniaThailandTimor-LesteTogoTongaTrinidad and TobagoTunisiaTurkeyTurkmenistanUgandaUkraineUnited Arab EmiratesUnited KingdomUnited StatesUpper middle incomeUruguayUzbekistanVanuatuVenezuela, RBVietnamWest Bank and GazaWorldYemen, Rep.ZambiaZimbabwe Timeline:
This timeline shows a graph from 1991 to 2016 of Belarus. No data until 1990. Number of actual observations by date: 26.
Source name:
World Development Indicators
Source organization:
World Bank national accounts data, and OECD National Accounts data files.
Categories, topics:
Economy & Growth
Last updated:
apr 23, 2017
Indicators value changes by year
Minimum:
2.367 bln
jan 1, 2000
Maximum:
10.886 bln
jan 1, 2015
At the date of observation
Value
Absolute change
Change from previous value
jan 1, 1991
4.132 bln
+4.132 bln
0.0%
jan 1, 1992
3.784 bln
-348.243 mln
-8.43%
jan 1, 1993
2.668 bln
-1.116 bln
-29.49%
jan 1, 1994
3.012 bln
+344.021 mln
12.89%
jan 1, 1995
3.063 bln
+50.686 mln
1.68%
jan 1, 1996
2.871 bln
-191.267 mln
-6.25%
jan 1, 1997
3.033 bln
+161.4 mln
5.62%
jan 1, 1998
2.871 bln
-161.601 mln
-5.33%
jan 1, 1999
3.024 bln
+152.627 mln
5.32%
jan 1, 2000
2.367 bln
-656.363 mln
-21.71%
jan 1, 2001
2.481 bln
+113.505 mln
4.79%
jan 1, 2002
2.663 bln
+181.853 mln
7.33%
jan 1, 2003
3.069 bln
+406.404 mln
15.26%
jan 1, 2004
3.811 bln
+741.744 mln
24.17%
jan 1, 2005
4.768 bln
+956.948 mln
25.11%
jan 1, 2006
6.279 bln
+1.511 bln
31.7%
jan 1, 2007
7.099 bln
+820.129 mln
13.06%
jan 1, 2008
8.387 bln
+1.287 bln
18.13%
jan 1, 2009
10.039 bln
+1.653 bln
19.71%
jan 1, 2010
8.235 bln
-1.804 bln
-17.97%
jan 1, 2011
9.279 bln
+1.044 bln
12.68%
jan 1, 2012
8.32 bln
-959.501 mln
-10.34%
jan 1, 2013
8.961 bln
+641.11 mln
7.71%
jan 1, 2014
10.235 bln
+1.274 bln
14.22%
jan 1, 2015
10.886 bln
+650.819 mln
6.36%
jan 1, 2016
8.161 bln
-2.725 bln
-25.03%
Ranking of countries by current statistics by years


Comments: