29
/
en
AIzaSyAYiBZKx7MnpbEhh9jyipgxe19OcubqV5w
April 1, 2024
206764
Nepal
NPL
true
2
1
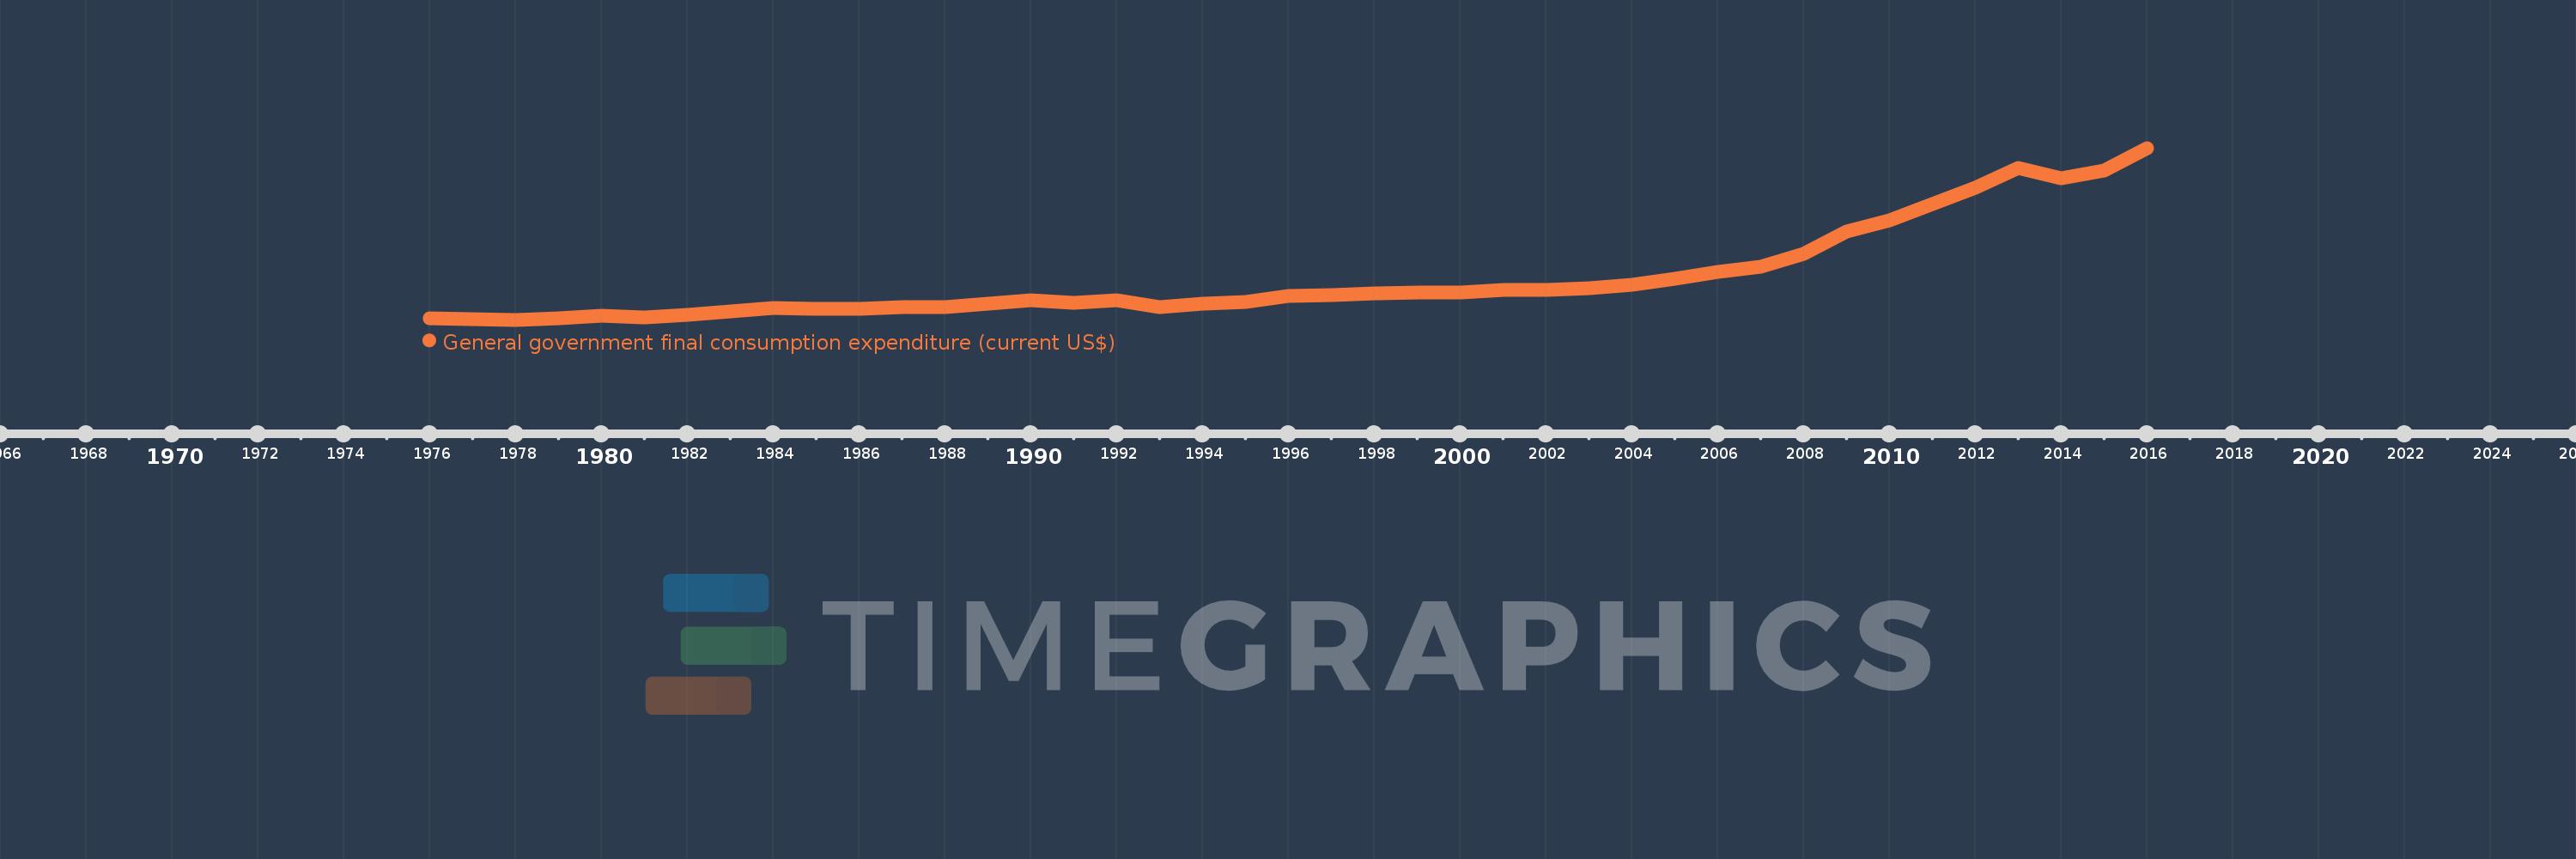
General government final consumption expenditure (current US$)
2016,2015,2014,2013,2012,2011,2010,2009,2008,2007,2006,2005,2004,2003,2002,2001,2000,1999,1998,1997,1996,1995,1994,1993,1992,1991,1990,1989,1988,1987,1986,1985,1984,1983,1982,1981,1980,1979,1978,1977,1976
This statistics in other country:
AfghanistanAlbaniaAlgeriaAngolaAntigua and BarbudaArab WorldArgentinaArmeniaArubaAustraliaAustriaAzerbaijanBahamas, TheBahrainBangladeshBarbadosBelarusBelgiumBelizeBeninBermudaBhutanBoliviaBosnia and HerzegovinaBotswanaBrazilBrunei DarussalamBulgariaBurkina FasoBurundiCabo VerdeCambodiaCameroonCanadaCaribbean small statesCentral African RepublicCentral Europe and the BalticsChadChileChinaColombiaComorosCongo, Dem. Rep.Congo, Rep.Costa RicaCote d'IvoireCroatiaCubaCyprusCzech RepublicDenmarkDjiboutiDominicaDominican RepublicEarly-demographic dividendEast Asia & PacificEast Asia & Pacific (excluding high income)East Asia & Pacific (IDA & IBRD countries)EcuadorEgypt, Arab Rep.El SalvadorEquatorial GuineaEritreaEstoniaEthiopiaEuro areaEurope & Central AsiaEurope & Central Asia (excluding high income)Europe & Central Asia (IDA & IBRD countries)European UnionFaroe IslandsFijiFinlandFragile and conflict affected situationsFranceFrench PolynesiaGabonGambia, TheGeorgiaGermanyGhanaGreeceGrenadaGuatemalaGuineaGuinea-BissauGuyanaHaitiHeavily indebted poor countries (HIPC)High incomeHondurasHong Kong SAR, ChinaHungaryIBRD onlyIcelandIDA & IBRD totalIDA blendIDA onlyIDA totalIndiaIndonesiaIran, Islamic Rep.IraqIrelandIsraelItalyJamaicaJapanJordanKazakhstanKenyaKiribatiKorea, Rep.KosovoKuwaitKyrgyz RepublicLao PDRLate-demographic dividendLatin America & Caribbean Latin America & Caribbean (excluding high income)Latin America & the Caribbean (IDA & IBRD countries)LatviaLeast developed countries: UN classificationLebanonLesothoLiberiaLibyaLithuaniaLow & middle incomeLow incomeLower middle incomeLuxembourgMacao SAR, ChinaMacedonia, FYRMadagascarMalawiMalaysiaMaldivesMaliMaltaMauritaniaMauritiusMexicoMicronesia, Fed. Sts.Middle East & North AfricaMiddle East & North Africa (excluding high income)Middle East & North Africa (IDA & IBRD countries)Middle incomeMoldovaMongoliaMontenegroMoroccoMozambiqueNamibiaNepalNetherlandsNew CaledoniaNew ZealandNicaraguaNigerNigeriaNorth AmericaNorwayOECD membersOmanOther small statesPakistanPanamaPapua New GuineaParaguayPeruPhilippinesPolandPortugalPost-demographic dividendPre-demographic dividendPuerto RicoQatarRomaniaRussian FederationRwandaSaudi ArabiaSenegalSerbiaSeychellesSierra LeoneSingaporeSlovak RepublicSloveniaSmall statesSolomon IslandsSomaliaSouth AfricaSouth AsiaSouth Asia (IDA & IBRD)South SudanSpainSri LankaSt. Kitts and NevisSt. LuciaSt. Vincent and the GrenadinesSub-Saharan Africa Sub-Saharan Africa (excluding high income)Sub-Saharan Africa (IDA & IBRD countries)SudanSurinameSwazilandSwedenSwitzerlandSyrian Arab RepublicTajikistanTanzaniaThailandTimor-LesteTogoTongaTrinidad and TobagoTunisiaTurkeyTurkmenistanUgandaUkraineUnited Arab EmiratesUnited KingdomUnited StatesUpper middle incomeUruguayUzbekistanVanuatuVenezuela, RBVietnamWest Bank and GazaWorldYemen, Rep.ZambiaZimbabwe Timeline:
This timeline shows a graph from 1976 to 2016 of Nepal. No data until 1975. Number of actual observations by date: 41.
Source name:
World Development Indicators
Source organization:
World Bank national accounts data, and OECD National Accounts data files.
Categories, topics:
Economy & Growth
Last updated:
apr 23, 2017
Indicators value changes by year
Minimum:
100.8 mln
jan 1, 1978
Maximum:
2.324 bln
jan 1, 2016
At the date of observation
Value
Absolute change
Change from previous value
jan 1, 1976
119.532 mln
+119.532 mln
0.0%
jan 1, 1977
108.078 mln
-11.454 mln
-9.58%
jan 1, 1978
100.8 mln
-7.278 mln
-6.73%
jan 1, 1979
119.589 mln
+18.789 mln
18.64%
jan 1, 1980
157.417 mln
+37.828 mln
31.63%
jan 1, 1981
130.417 mln
-27.0 mln
-17.15%
jan 1, 1982
160.167 mln
+29.75 mln
22.81%
jan 1, 1983
203.922 mln
+43.756 mln
27.32%
jan 1, 1984
247.617 mln
+43.695 mln
21.43%
jan 1, 1985
238.79 mln
-8.827 mln
-3.56%
jan 1, 1986
245.817 mln
+7.028 mln
2.94%
jan 1, 1987
259.12 mln
+13.303 mln
5.41%
jan 1, 1988
268.433 mln
+9.313 mln
3.59%
jan 1, 1989
312.628 mln
+44.194 mln
16.46%
jan 1, 1990
353.317 mln
+40.689 mln
13.02%
jan 1, 1991
314.258 mln
-39.058 mln
-11.05%
jan 1, 1992
351.124 mln
+36.866 mln
11.73%
jan 1, 1993
265.212 mln
-85.913 mln
-24.47%
jan 1, 1994
310.417 mln
+45.205 mln
17.04%
jan 1, 1995
326.265 mln
+15.849 mln
5.11%
jan 1, 1996
406.968 mln
+80.703 mln
24.74%
jan 1, 1997
418.129 mln
+11.161 mln
2.74%
jan 1, 1998
438.138 mln
+20.009 mln
4.79%
jan 1, 1999
452.22 mln
+14.082 mln
3.21%
jan 1, 2000
449.286 mln
-2.933 mln
-0.65%
jan 1, 2001
491.733 mln
+42.447 mln
9.45%
jan 1, 2002
486.871 mln
-4.862 mln
-0.99%
jan 1, 2003
508.179 mln
+21.308 mln
4.38%
jan 1, 2004
548.538 mln
+40.359 mln
7.94%
jan 1, 2005
628.765 mln
+80.227 mln
14.63%
jan 1, 2006
723.529 mln
+94.764 mln
15.07%
jan 1, 2007
785.264 mln
+61.736 mln
8.53%
jan 1, 2008
949.8 mln
+164.535 mln
20.95%
jan 1, 2009
1.241 bln
+290.859 mln
30.62%
jan 1, 2010
1.386 bln
+144.996 mln
11.69%
jan 1, 2011
1.599 bln
+213.426 mln
15.4%
jan 1, 2012
1.805 bln
+206.254 mln
12.9%
jan 1, 2013
2.067 bln
+261.65 mln
14.49%
jan 1, 2014
1.927 bln
-140.148 mln
-6.78%
jan 1, 2015
2.036 bln
+109.435 mln
5.68%
jan 1, 2016
2.324 bln
+287.976 mln
14.14%
Ranking of countries by current statistics by years


Comments: