29
/
en
AIzaSyAYiBZKx7MnpbEhh9jyipgxe19OcubqV5w
April 1, 2024
77131
Bahrain
BHR
true
2
1
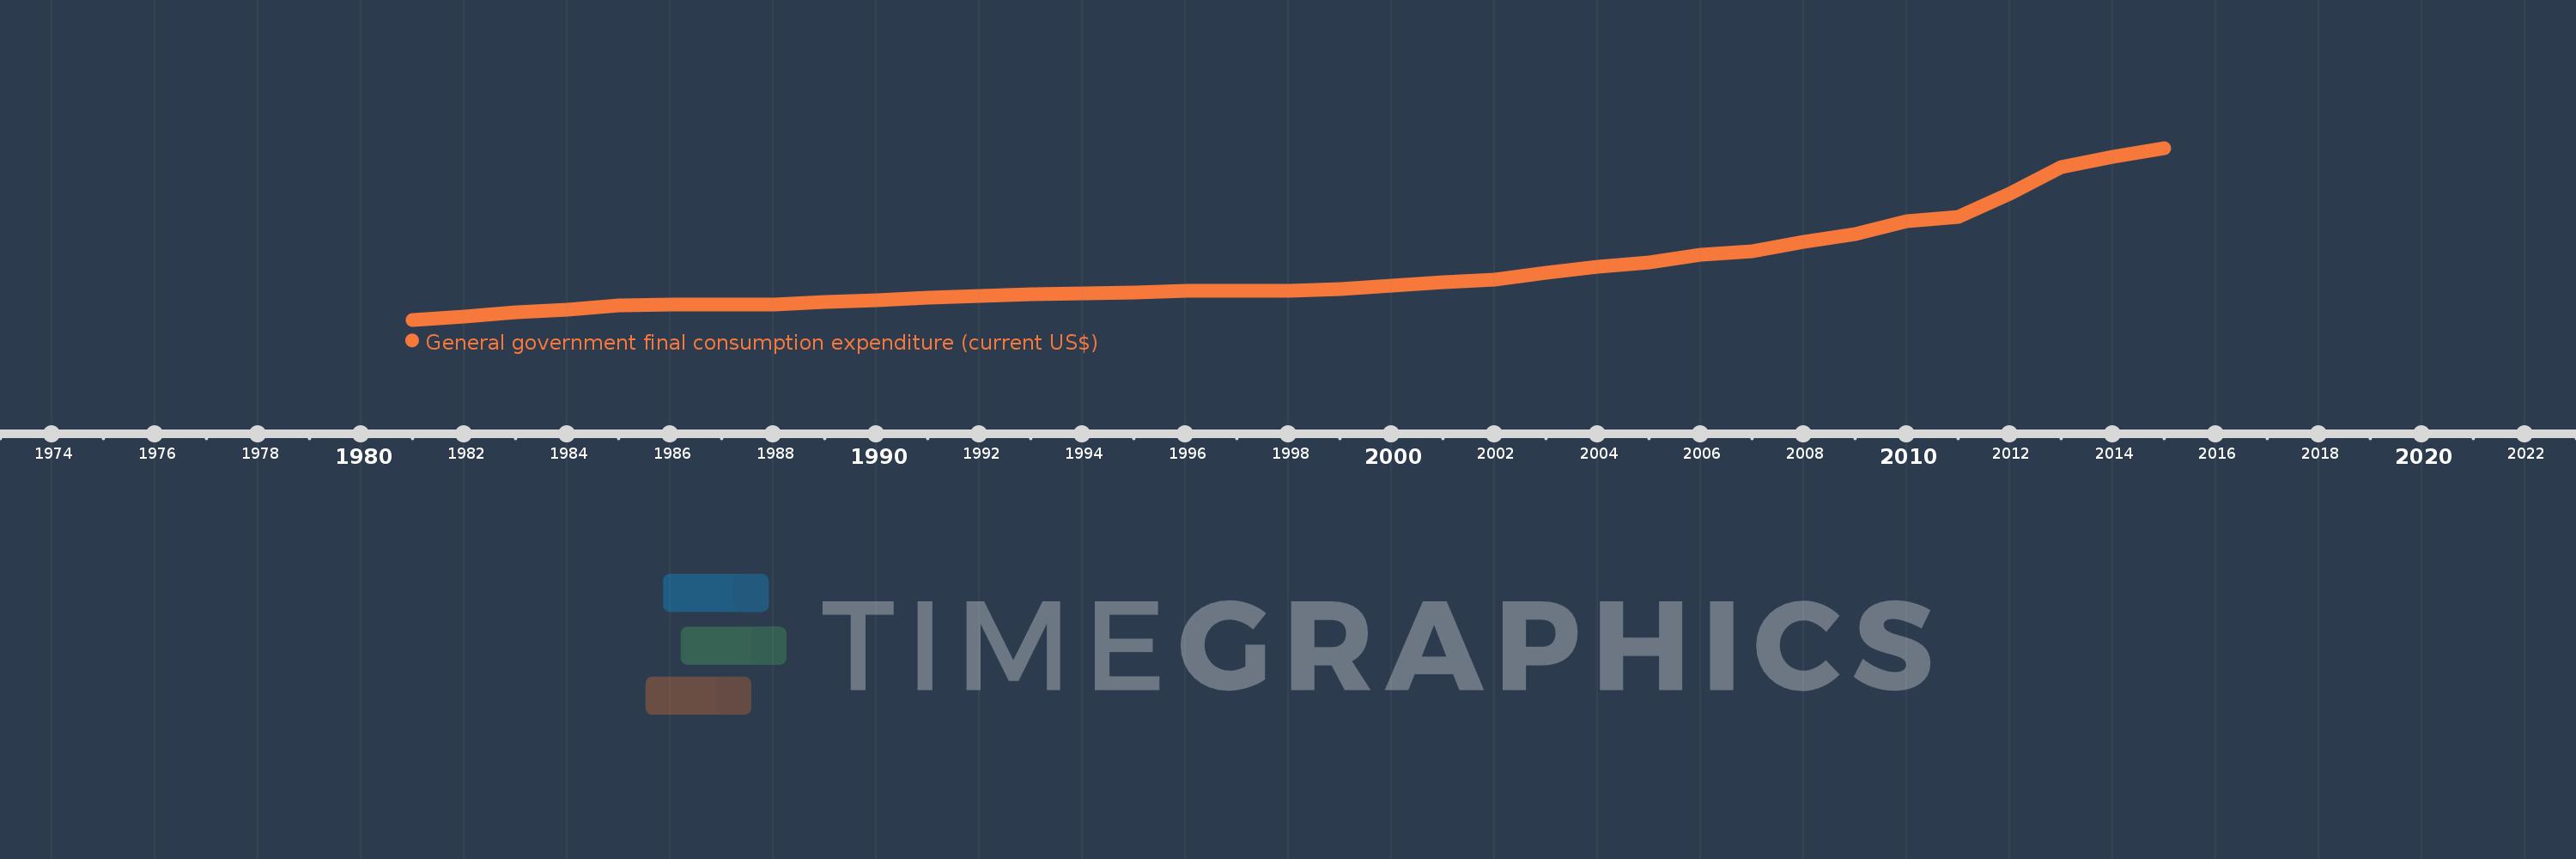
General government final consumption expenditure (current US$)
2015,2014,2013,2012,2011,2010,2009,2008,2007,2006,2005,2004,2003,2002,2001,2000,1999,1998,1997,1996,1995,1994,1993,1992,1991,1990,1989,1988,1987,1986,1985,1984,1983,1982,1981
This statistics in other country:
AfghanistanAlbaniaAlgeriaAngolaAntigua and BarbudaArab WorldArgentinaArmeniaArubaAustraliaAustriaAzerbaijanBahamas, TheBahrainBangladeshBarbadosBelarusBelgiumBelizeBeninBermudaBhutanBoliviaBosnia and HerzegovinaBotswanaBrazilBrunei DarussalamBulgariaBurkina FasoBurundiCabo VerdeCambodiaCameroonCanadaCaribbean small statesCentral African RepublicCentral Europe and the BalticsChadChileChinaColombiaComorosCongo, Dem. Rep.Congo, Rep.Costa RicaCote d'IvoireCroatiaCubaCyprusCzech RepublicDenmarkDjiboutiDominicaDominican RepublicEarly-demographic dividendEast Asia & PacificEast Asia & Pacific (excluding high income)East Asia & Pacific (IDA & IBRD countries)EcuadorEgypt, Arab Rep.El SalvadorEquatorial GuineaEritreaEstoniaEthiopiaEuro areaEurope & Central AsiaEurope & Central Asia (excluding high income)Europe & Central Asia (IDA & IBRD countries)European UnionFaroe IslandsFijiFinlandFragile and conflict affected situationsFranceFrench PolynesiaGabonGambia, TheGeorgiaGermanyGhanaGreeceGrenadaGuatemalaGuineaGuinea-BissauGuyanaHaitiHeavily indebted poor countries (HIPC)High incomeHondurasHong Kong SAR, ChinaHungaryIBRD onlyIcelandIDA & IBRD totalIDA blendIDA onlyIDA totalIndiaIndonesiaIran, Islamic Rep.IraqIrelandIsraelItalyJamaicaJapanJordanKazakhstanKenyaKiribatiKorea, Rep.KosovoKuwaitKyrgyz RepublicLao PDRLate-demographic dividendLatin America & Caribbean Latin America & Caribbean (excluding high income)Latin America & the Caribbean (IDA & IBRD countries)LatviaLeast developed countries: UN classificationLebanonLesothoLiberiaLibyaLithuaniaLow & middle incomeLow incomeLower middle incomeLuxembourgMacao SAR, ChinaMacedonia, FYRMadagascarMalawiMalaysiaMaldivesMaliMaltaMauritaniaMauritiusMexicoMicronesia, Fed. Sts.Middle East & North AfricaMiddle East & North Africa (excluding high income)Middle East & North Africa (IDA & IBRD countries)Middle incomeMoldovaMongoliaMontenegroMoroccoMozambiqueNamibiaNepalNetherlandsNew CaledoniaNew ZealandNicaraguaNigerNigeriaNorth AmericaNorwayOECD membersOmanOther small statesPakistanPanamaPapua New GuineaParaguayPeruPhilippinesPolandPortugalPost-demographic dividendPre-demographic dividendPuerto RicoQatarRomaniaRussian FederationRwandaSaudi ArabiaSenegalSerbiaSeychellesSierra LeoneSingaporeSlovak RepublicSloveniaSmall statesSolomon IslandsSomaliaSouth AfricaSouth AsiaSouth Asia (IDA & IBRD)South SudanSpainSri LankaSt. Kitts and NevisSt. LuciaSt. Vincent and the GrenadinesSub-Saharan Africa Sub-Saharan Africa (excluding high income)Sub-Saharan Africa (IDA & IBRD countries)SudanSurinameSwazilandSwedenSwitzerlandSyrian Arab RepublicTajikistanTanzaniaThailandTimor-LesteTogoTongaTrinidad and TobagoTunisiaTurkeyTurkmenistanUgandaUkraineUnited Arab EmiratesUnited KingdomUnited StatesUpper middle incomeUruguayUzbekistanVanuatuVenezuela, RBVietnamWest Bank and GazaWorldYemen, Rep.ZambiaZimbabwe Timeline:
This timeline shows a graph from 1981 to 2015 of Bahrain. No data until 1980. Number of actual observations by date: 35.
Source name:
World Development Indicators
Source organization:
World Bank national accounts data, and OECD National Accounts data files.
Categories, topics:
Economy & Growth
Last updated:
apr 23, 2017
Indicators value changes by year
Minimum:
400.371 mln
jan 1, 1981
Maximum:
5.301 bln
jan 1, 2015
At the date of observation
Value
Absolute change
Change from previous value
jan 1, 1981
400.371 mln
+400.371 mln
0.0%
jan 1, 1982
501.596 mln
+101.224 mln
25.28%
jan 1, 1983
620.479 mln
+118.883 mln
23.7%
jan 1, 1984
676.862 mln
+56.383 mln
9.09%
jan 1, 1985
803.724 mln
+126.862 mln
18.74%
jan 1, 1986
831.915 mln
+28.191 mln
3.51%
jan 1, 1987
830.851 mln
-1.064 mln
-0.13%
jan 1, 1988
826.862 mln
-3.989 mln
-0.48%
jan 1, 1989
902.128 mln
+75.266 mln
9.1%
jan 1, 1990
948.67 mln
+46.542 mln
5.16%
jan 1, 1991
1.024 bln
+75.532 mln
7.96%
jan 1, 1992
1.08 bln
+55.585 mln
5.43%
jan 1, 1993
1.134 bln
+53.723 mln
4.98%
jan 1, 1994
1.158 bln
+24.734 mln
2.18%
jan 1, 1995
1.17 bln
+11.968 mln
1.03%
jan 1, 1996
1.219 bln
+49.202 mln
4.2%
jan 1, 1997
1.235 bln
+15.426 mln
1.26%
jan 1, 1998
1.237 bln
+2.128 mln
0.17%
jan 1, 1999
1.284 bln
+47.074 mln
3.81%
jan 1, 2000
1.378 bln
+94.149 mln
7.33%
jan 1, 2001
1.469 bln
+90.809 mln
6.59%
jan 1, 2002
1.549 bln
+80.329 mln
5.47%
jan 1, 2003
1.734 bln
+184.39 mln
11.9%
jan 1, 2004
1.918 bln
+183.999 mln
10.61%
jan 1, 2005
2.03 bln
+112.457 mln
5.86%
jan 1, 2006
2.245 bln
+214.508 mln
10.57%
jan 1, 2007
2.353 bln
+107.815 mln
4.8%
jan 1, 2008
2.629 bln
+276.782 mln
11.77%
jan 1, 2009
2.846 bln
+216.729 mln
8.24%
jan 1, 2010
3.206 bln
+360.372 mln
12.66%
jan 1, 2011
3.324 bln
+117.819 mln
3.67%
jan 1, 2012
3.992 bln
+667.952 mln
20.09%
jan 1, 2013
4.748 bln
+756.25 mln
18.94%
jan 1, 2014
5.056 bln
+307.527 mln
6.48%
jan 1, 2015
5.301 bln
+244.973 mln
4.85%
Ranking of countries by current statistics by years


Comments: