29
/
en
AIzaSyAYiBZKx7MnpbEhh9jyipgxe19OcubqV5w
April 1, 2024
224863
Poland
POL
true
2
1
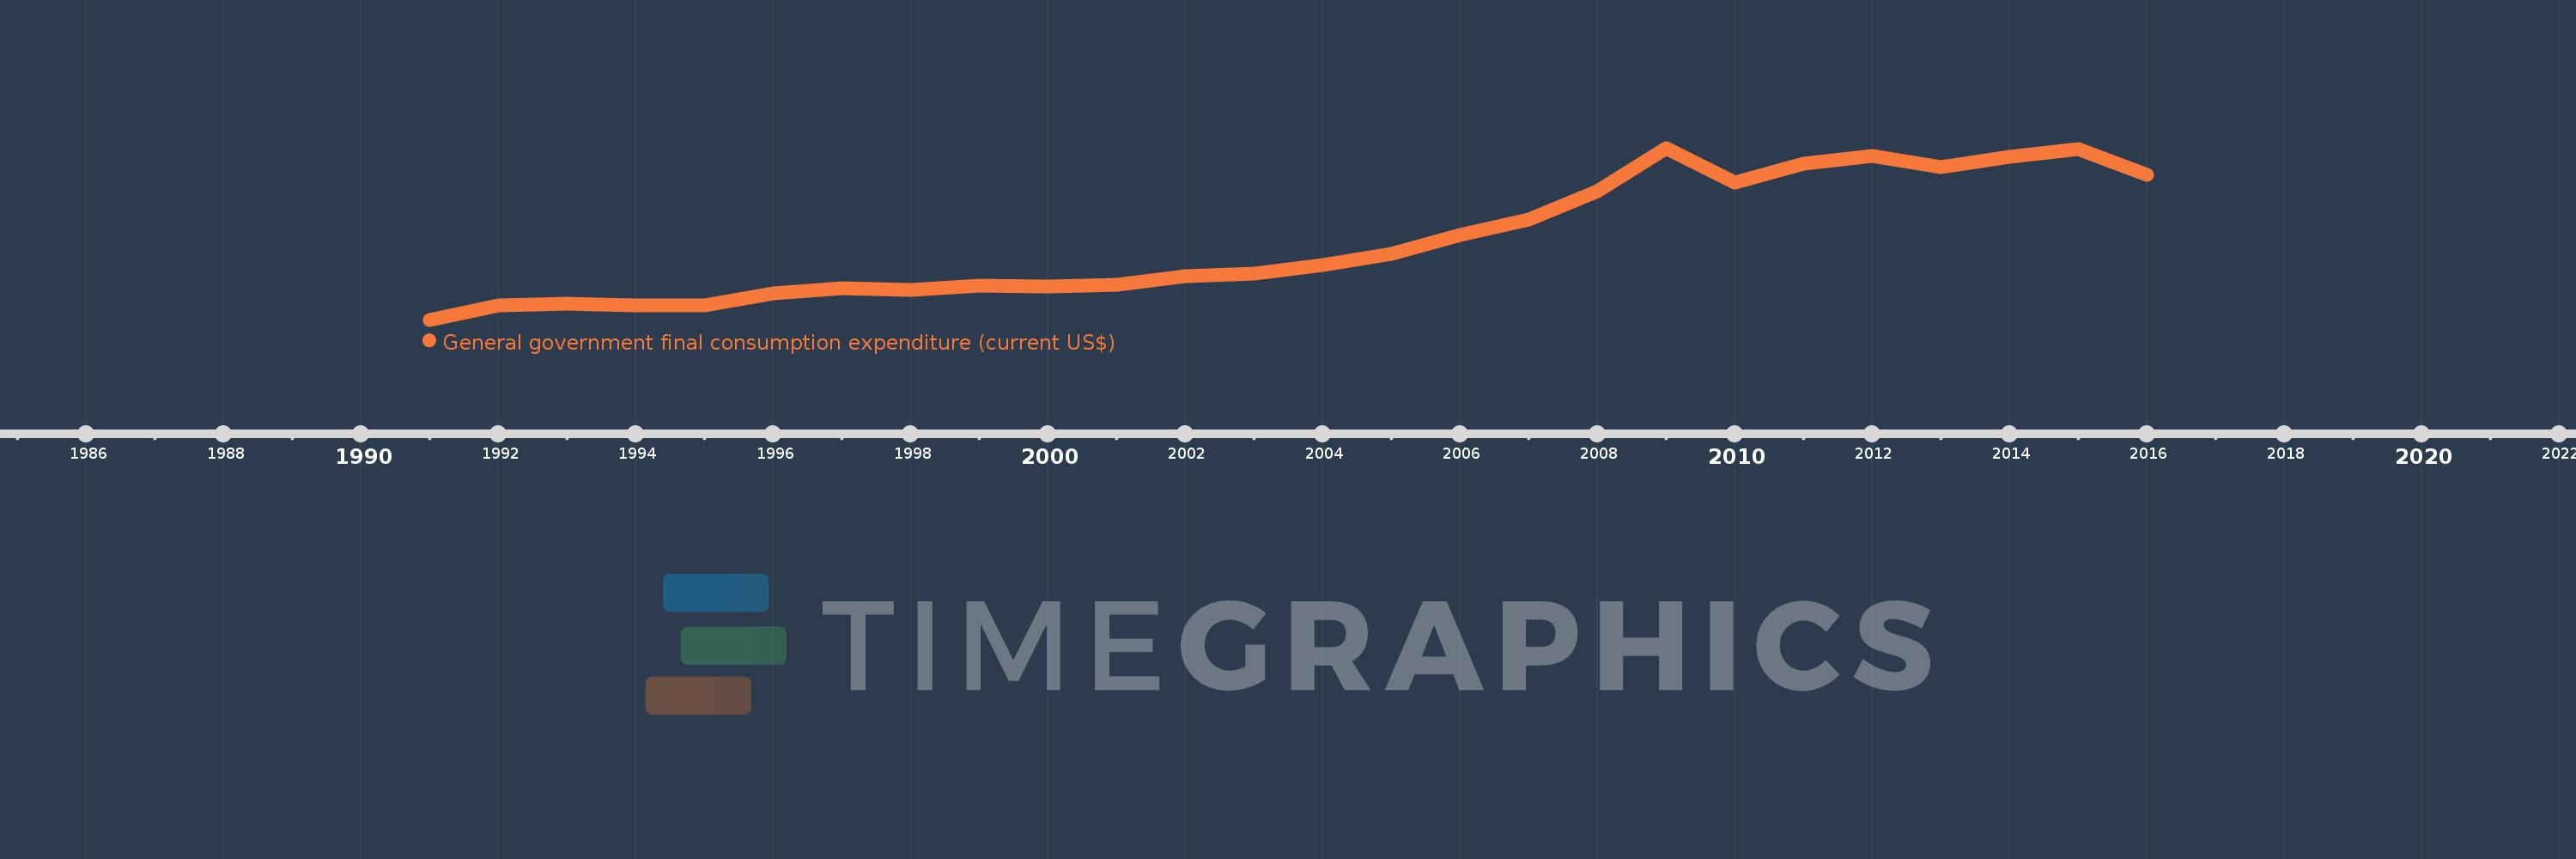
General government final consumption expenditure (current US$)
2016,2015,2014,2013,2012,2011,2010,2009,2008,2007,2006,2005,2004,2003,2002,2001,2000,1999,1998,1997,1996,1995,1994,1993,1992,1991
This statistics in other country:
AfghanistanAlbaniaAlgeriaAngolaAntigua and BarbudaArab WorldArgentinaArmeniaArubaAustraliaAustriaAzerbaijanBahamas, TheBahrainBangladeshBarbadosBelarusBelgiumBelizeBeninBermudaBhutanBoliviaBosnia and HerzegovinaBotswanaBrazilBrunei DarussalamBulgariaBurkina FasoBurundiCabo VerdeCambodiaCameroonCanadaCaribbean small statesCentral African RepublicCentral Europe and the BalticsChadChileChinaColombiaComorosCongo, Dem. Rep.Congo, Rep.Costa RicaCote d'IvoireCroatiaCubaCyprusCzech RepublicDenmarkDjiboutiDominicaDominican RepublicEarly-demographic dividendEast Asia & PacificEast Asia & Pacific (excluding high income)East Asia & Pacific (IDA & IBRD countries)EcuadorEgypt, Arab Rep.El SalvadorEquatorial GuineaEritreaEstoniaEthiopiaEuro areaEurope & Central AsiaEurope & Central Asia (excluding high income)Europe & Central Asia (IDA & IBRD countries)European UnionFaroe IslandsFijiFinlandFragile and conflict affected situationsFranceFrench PolynesiaGabonGambia, TheGeorgiaGermanyGhanaGreeceGrenadaGuatemalaGuineaGuinea-BissauGuyanaHaitiHeavily indebted poor countries (HIPC)High incomeHondurasHong Kong SAR, ChinaHungaryIBRD onlyIcelandIDA & IBRD totalIDA blendIDA onlyIDA totalIndiaIndonesiaIran, Islamic Rep.IraqIrelandIsraelItalyJamaicaJapanJordanKazakhstanKenyaKiribatiKorea, Rep.KosovoKuwaitKyrgyz RepublicLao PDRLate-demographic dividendLatin America & Caribbean Latin America & Caribbean (excluding high income)Latin America & the Caribbean (IDA & IBRD countries)LatviaLeast developed countries: UN classificationLebanonLesothoLiberiaLibyaLithuaniaLow & middle incomeLow incomeLower middle incomeLuxembourgMacao SAR, ChinaMacedonia, FYRMadagascarMalawiMalaysiaMaldivesMaliMaltaMauritaniaMauritiusMexicoMicronesia, Fed. Sts.Middle East & North AfricaMiddle East & North Africa (excluding high income)Middle East & North Africa (IDA & IBRD countries)Middle incomeMoldovaMongoliaMontenegroMoroccoMozambiqueNamibiaNepalNetherlandsNew CaledoniaNew ZealandNicaraguaNigerNigeriaNorth AmericaNorwayOECD membersOmanOther small statesPakistanPanamaPapua New GuineaParaguayPeruPhilippinesPolandPortugalPost-demographic dividendPre-demographic dividendPuerto RicoQatarRomaniaRussian FederationRwandaSaudi ArabiaSenegalSerbiaSeychellesSierra LeoneSingaporeSlovak RepublicSloveniaSmall statesSolomon IslandsSomaliaSouth AfricaSouth AsiaSouth Asia (IDA & IBRD)South SudanSpainSri LankaSt. Kitts and NevisSt. LuciaSt. Vincent and the GrenadinesSub-Saharan Africa Sub-Saharan Africa (excluding high income)Sub-Saharan Africa (IDA & IBRD countries)SudanSurinameSwazilandSwedenSwitzerlandSyrian Arab RepublicTajikistanTanzaniaThailandTimor-LesteTogoTongaTrinidad and TobagoTunisiaTurkeyTurkmenistanUgandaUkraineUnited Arab EmiratesUnited KingdomUnited StatesUpper middle incomeUruguayUzbekistanVanuatuVenezuela, RBVietnamWest Bank and GazaWorldYemen, Rep.ZambiaZimbabwe Timeline:
This timeline shows a graph from 1991 to 2016 of Poland. No data until 1990. Number of actual observations by date: 26.
Source name:
World Development Indicators
Source organization:
World Bank national accounts data, and OECD National Accounts data files.
Categories, topics:
Economy & Growth
Last updated:
apr 23, 2017
Indicators value changes by year
Minimum:
13.88 bln
jan 1, 1991
Maximum:
99.306 bln
jan 1, 2009
At the date of observation
Value
Absolute change
Change from previous value
jan 1, 1991
13.88 bln
+13.88 bln
0.0%
jan 1, 1992
21.016 bln
+7.136 bln
51.41%
jan 1, 1993
21.97 bln
+953.317 mln
4.54%
jan 1, 1994
21.068 bln
-901.079 mln
-4.1%
jan 1, 1995
20.94 bln
-128.06 mln
-0.61%
jan 1, 1996
26.828 bln
+5.888 bln
28.12%
jan 1, 1997
29.593 bln
+2.765 bln
10.31%
jan 1, 1998
28.777 bln
-816.004 mln
-2.76%
jan 1, 1999
30.876 bln
+2.098 bln
7.29%
jan 1, 2000
30.349 bln
-526.461 mln
-1.71%
jan 1, 2001
31.069 bln
+719.883 mln
2.37%
jan 1, 2002
35.548 bln
+4.479 bln
14.42%
jan 1, 2003
37.015 bln
+1.467 bln
4.13%
jan 1, 2004
41.115 bln
+4.101 bln
11.08%
jan 1, 2005
46.632 bln
+5.517 bln
13.42%
jan 1, 2006
56.013 bln
+9.381 bln
20.12%
jan 1, 2007
63.715 bln
+7.702 bln
13.75%
jan 1, 2008
77.734 bln
+14.019 bln
22.0%
jan 1, 2009
99.306 bln
+21.572 bln
27.75%
jan 1, 2010
82.277 bln
-17.03 bln
-17.15%
jan 1, 2011
91.644 bln
+9.368 bln
11.39%
jan 1, 2012
95.458 bln
+3.814 bln
4.16%
jan 1, 2013
89.7 bln
-5.758 bln
-6.03%
jan 1, 2014
95.031 bln
+5.331 bln
5.94%
jan 1, 2015
98.914 bln
+3.883 bln
4.09%
jan 1, 2016
85.814 bln
-13.1 bln
-13.24%
Ranking of countries by current statistics by years


Comments: